ROS 2 Course Repository
- Author: Eduardo de Jesús Dávila Meza, Ph.D.
- Email: eduardodavila94@hotmail.com
- LinkedIn: EduardoDavila-AI
- HackerRank: eduardodavila94
Official repository for the ROS 2 course taught at Tecnológico de Monterrey, Campus Guadalajara. This course is designed for students in the Robotics and Intelligent Systems Engineering program and aims to provide a solid foundation in the use and development of ROS 2 Humble applications.
Instructions to launch the ROS 2 Packages
1. Running ROS 2 Examples
Examples to Try
Talker-Listener
After installing ros-humble-desktop (and optionally Terminator), try the following:
-
In Terminal 1, source the setup file and run a C++ talker:
source /opt/ros/humble/setup.bash ros2 run demo_nodes_cpp talker -
In Terminal 2, source the setup file and run a Python listener:
source /opt/ros/humble/setup.bash
ros2 run demo_nodes_py listener
You should observe that the talker publishes messages and the listener confirms their reception.
Turtlesim: Publish and Move a Turtle
Another example is provided by the turtlesim package:
-
In Terminal 3, run the turtlesim node:
ros2 run turtlesim turtlesim_node -
In Terminal 4, run the teleoperation node to control the turtle:
ros2 run turtlesim turtle_teleop_key
Use the arrow keys to move the turtle. This example demonstrates publishing velocity commands to control the simulated turtle.
Evidence:
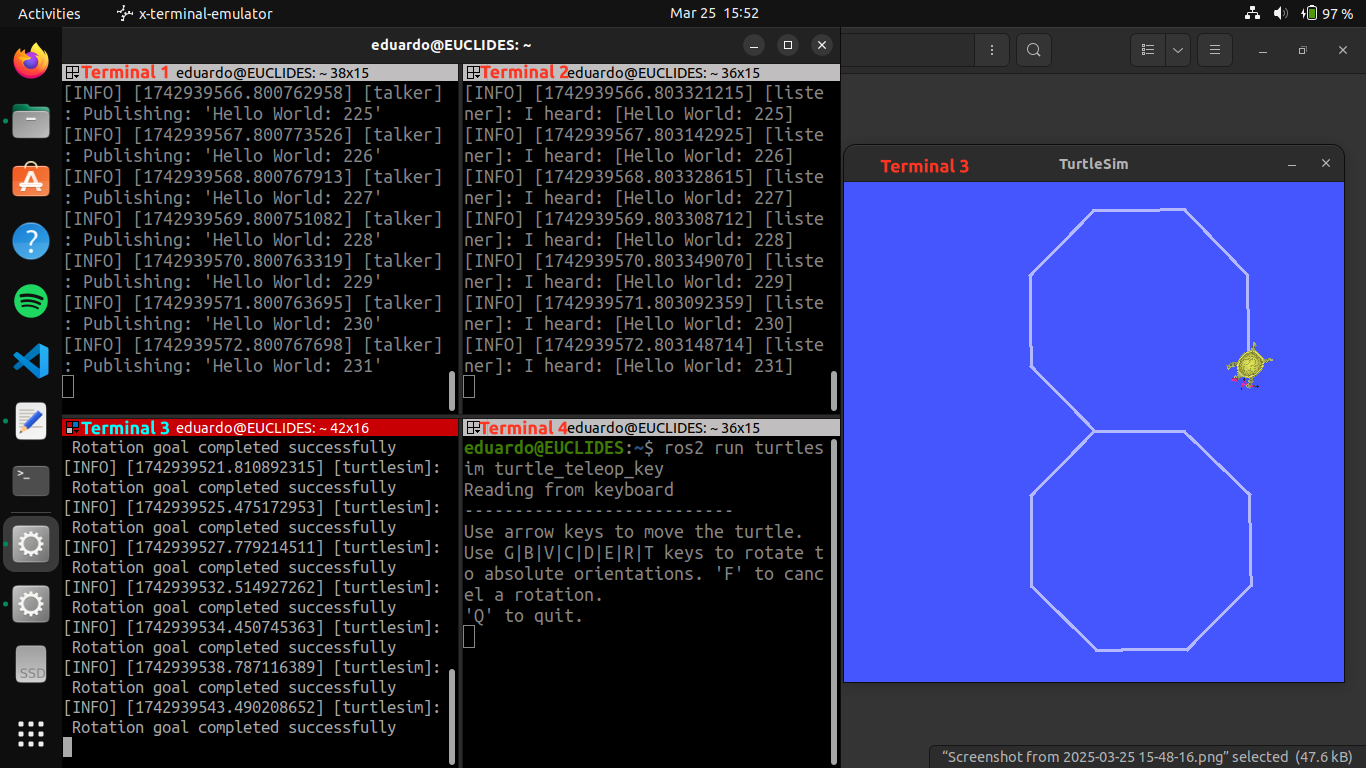 Figure: Example screenshot showing terminal outputs from both the Talker-Listener example and the Turtlesim node example in action.
2. Running ROS 2 Nodes
Executing ROS 2 Publishers and Subscribers
Running the Python Publisher and Subscriber
After implementing and saving your Python nodes and updating package.xml and setup.py files, build your package and run the nodes. In two separate terminal sessions (or using the Terminator emulator), execute the following commands from the root of your workspace:
-
Terminal 1: Build your package, source the setup file, and run the Python publisher node:
colcon build --packages-select s2_py_pubsub source install/setup.bash ros2 run s2_py_pubsub publisher_exe -
Terminal 2: Source the setup file and run the Python subscriber node:
source install/setup.bash
ros2 run s2_py_pubsub subscriber_exe
You should observe that the py_publisher node sends a personalized message (e.g., displaying your name), and the py_subscriber node awaits the reception of the messages.
Running the C++ Publisher and Subscriber
After implementing and saving your C++ nodes and updating package.xml and CMakeLists.txt files, build your package and run the nodes. In two additional terminal sessions (or another two sessions in Terminator), execute the following commands from the root of your workspace:
-
Terminal 3: Build your package, source the setup file, and run the C++ publisher node:
colcon build --packages-select s2_cpp_pubsub source install/setup.bash ros2 run s2_cpp_pubsub publisher_exe -
Terminal 4: Source the setup file and run the C++ subscriber node:
source install/setup.bash
ros2 run s2_cpp_pubsub subscriber_exe
You should observe that the py_publisher node publishes your personalized message (e.g., displaying your name), and the cpp_subscriber node confirms its reception. Likewise, the cpp_publisher node publishes your other personalized message, and the py_subscriber node confirms its reception.
Visualizing the ROS Graph with rqt_graph
To ensure that your publisher and subscriber nodes are correctly connected, use the rqt_graph tool. In Terminal 5, execute the following command (no need to enter your workspace directory):
ros2 run rqt_graph rqt_graph
or simply:
rqt_graph
This visualization should show the topics connecting your publisher and subscriber nodes.
Evidence:
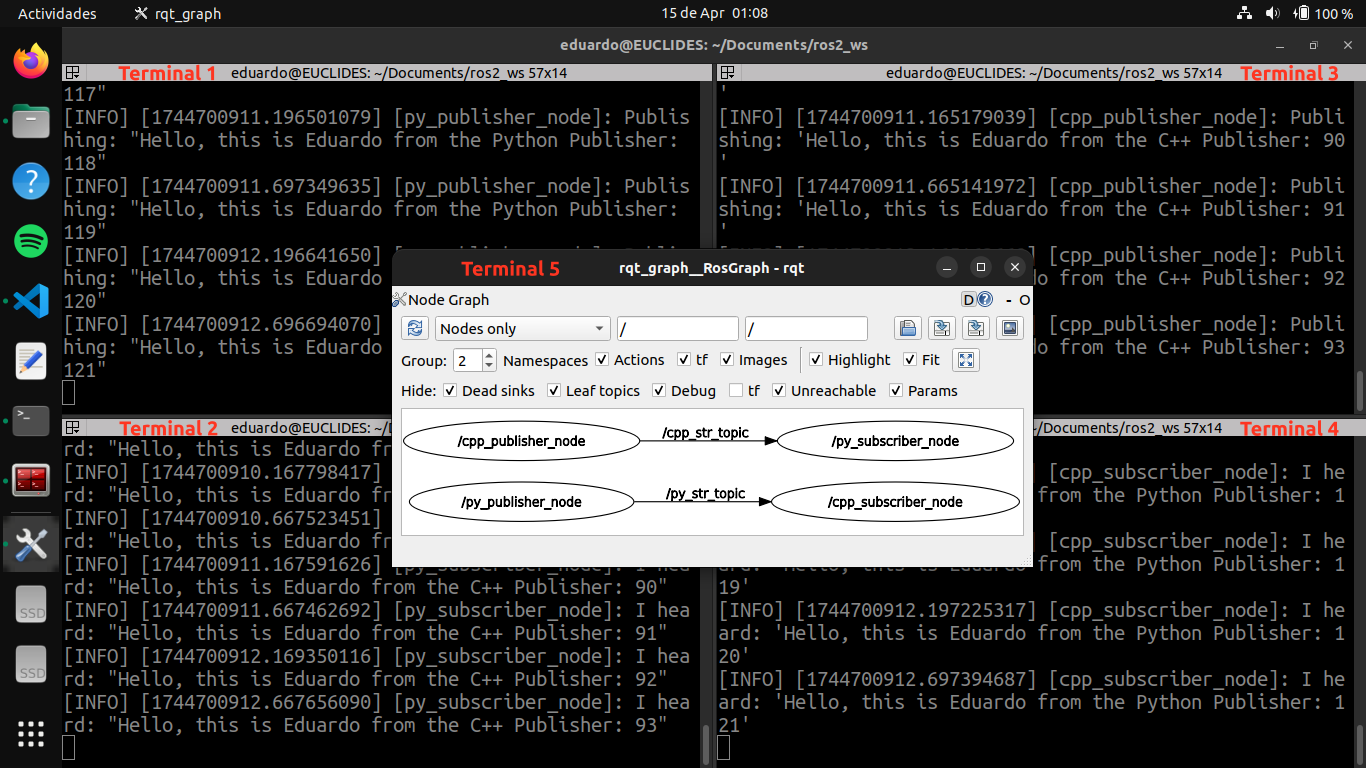 Figure: Example screenshot showing terminal outputs of the publisher and subscriber nodes, in C++ and Python, in action.
3. Running ROS 2 Services and Clients
Executing ROS 2 Services and Clients
Running the Python Service and Client
After implementing and saving your Python nodes and updating the package.xml and setup.py files, build your package and run the nodes. In three separate terminal sessions (or using the Terminator emulator), execute the following commands from the root of your workspace:
-
Terminal 1: Build your package, source the setup file, and launch the Python service node:
colcon build --packages-select s3_py_srvcli source install/setup.bash ros2 run s3_py_srvcli server_exe -
Terminal 2: Source the setup file and run the Python client node:
source install/setup.bash ros2 run s3_py_srvcli client_exe -11 -13 -
Terminal 3: Send a service request directly from the command line:
ros2 service call /py_add_two_ints_service example_interfaces/srv/AddTwoInts "{a: -2, b: -3}"
You should observe that the py_server node processes service requests from both the py_client node and the command-line client in Terminal 3.
Running the C++ Service and Client
After implementing and saving your C++ nodes and updating the package.xml and CMakeLists.txt files, build your package and run the nodes. In three additional terminal sessions (or three new sessions in Terminator), execute the following commands from the root of your workspace:
-
Terminal 4: Build your package, source the setup file, and launch the C++ service node:
colcon build --packages-select s3_cpp_srvcli source install/setup.bash ros2 run s3_cpp_srvcli server_exe -
Terminal 5: Source the setup file and run the C++ client node:
source install/setup.bash ros2 run s3_cpp_srvcli client_exe 11 13 -
Terminal 6: Send a service request directly from the command line:
ros2 service call /cpp_add_two_ints_service example_interfaces/srv/AddTwoInts "{a: 2, b: 3}"
You should observe that the cpp_server node processes service requests from both the cpp_client node and the command-line client in Terminal 6.
Requesting a Service Using rqt_service_caller
Use the rqt_service_caller tool to send service requests to both the Python and C++ servers. In Terminal 7, run:
ros2 run rqt_service_caller rqt_service_caller
Then, request a service call for:
/py_add_two_ints_servicewith the valuesa: -5,b: -7/cpp_add_two_ints_servicewith the valuesa: 5,b: 7
You should observe that the py_server and cpp_server nodes successfully process the service requests sent via rqt_service_caller.
Evidence:
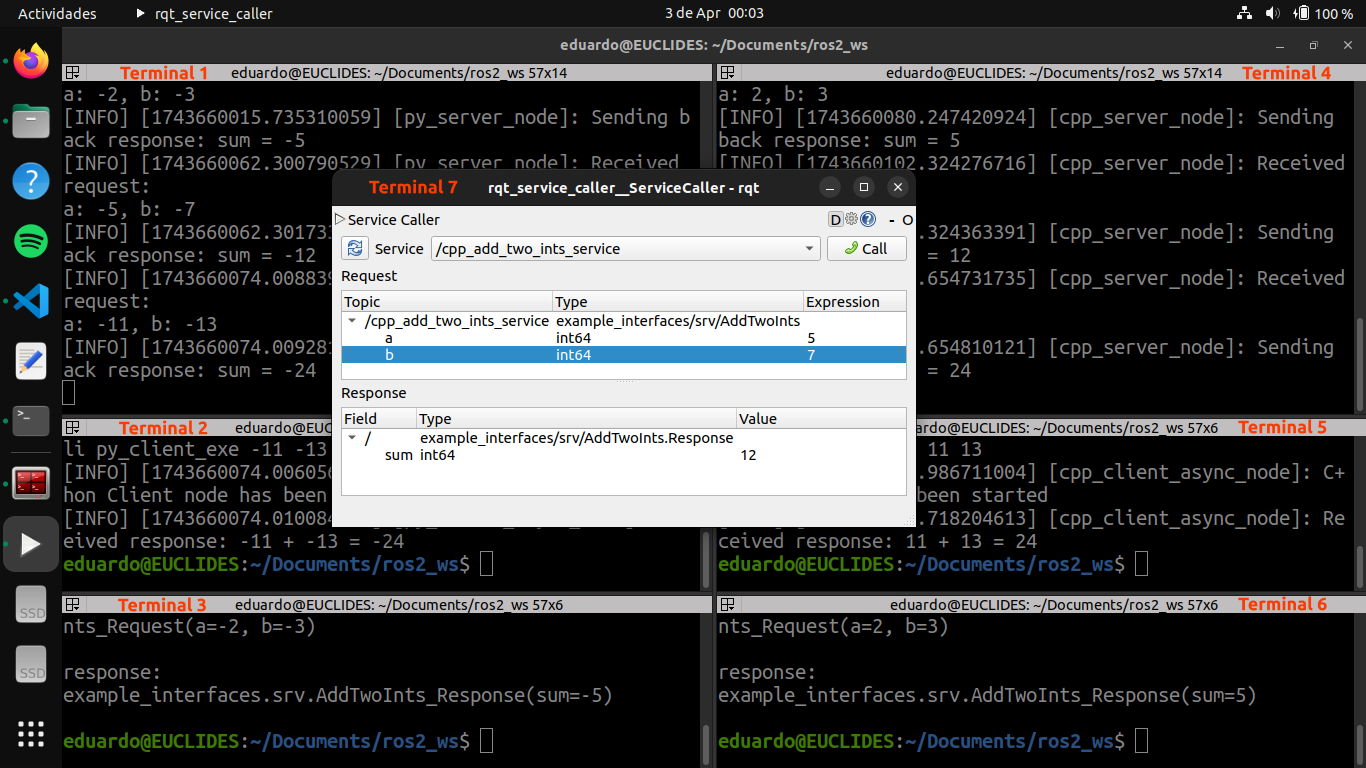 Figure: Example screenshot showing terminal outputs from the servers and clients in action.
4. ROS 2 Custom .msg and .srv Files
Executing ROS 2 Publishers, Subscribers, Services, and Clients
After editing and saving your custom .msg and .srv files, and updating your C++ and Python nodes along with CMakeLists.txt, setup.py, and package.xml, build the packages:
colcon build --packages-select s4_custom_interface
colcon build --packages-select s4_cpp_apps
colcon build --packages-select s4_py_apps
Then, in eight separate terminal sessions (or using the Terminator emulator), source your ROS 2 workspace in each terminal and run the nodes as follows:
-
Terminal 1: Run the Python publisher node:
source install/setup.bash ros2 run s4_py_apps publisher_exe -
Terminal 2: Run the Python subscriber node:
source install/setup.bash ros2 run s4_py_apps subscriber_exe -
Terminal 3: Run the Python server node:
source install/setup.bash ros2 run s4_py_apps server_exe -
Terminal 4: Run the Python client node:
source install/setup.bash ros2 run s4_py_apps client_exe -2 -3 -5 -
Terminal 5: Run the C++ publisher node:
source install/setup.bash ros2 run s4_cpp_apps publisher_exe -
Terminal 6: Run the C++ subscriber node:
source install/setup.bash ros2 run s4_cpp_apps subscriber_exe -
Terminal 7: Run the C++ server node:
source install/setup.bash ros2 run s4_cpp_apps server_exe -
Terminal 8: Run the C++ client node:
source install/setup.bash
ros2 run s4_cpp_apps client_exe 2 3 5
You should observe the following:
- The
py_publishernode publishes the customHardwareStatusandSpheremessages. - The
py_subscribernode receives theHardwareStatusmessage from thecpp_publisherand theSpheremessage from thepy_publisher. - The
py_servernode processes the service request from thepy_clientnode. - The
cpp_publishernode publishes the customHardwareStatusandSpheremessages. - The
cpp_subscribernode receives theHardwareStatusmessage from thepy_publisherand theSpheremessage from thecpp_publisher. - The
cpp_servernode processes the service request from thecpp_clientnode.
Visualizing the ROS Graph with rqt_graph
To verify that all nodes are correctly connected, use the rqt_graph tool.
In Terminal 9, run:
ros2 run rqt_graph rqt_graph
or simply:
rqt_graph
This will display a graph of all publishers, subscribers, and services, confirming proper communication and node topology.
Evidence 1:
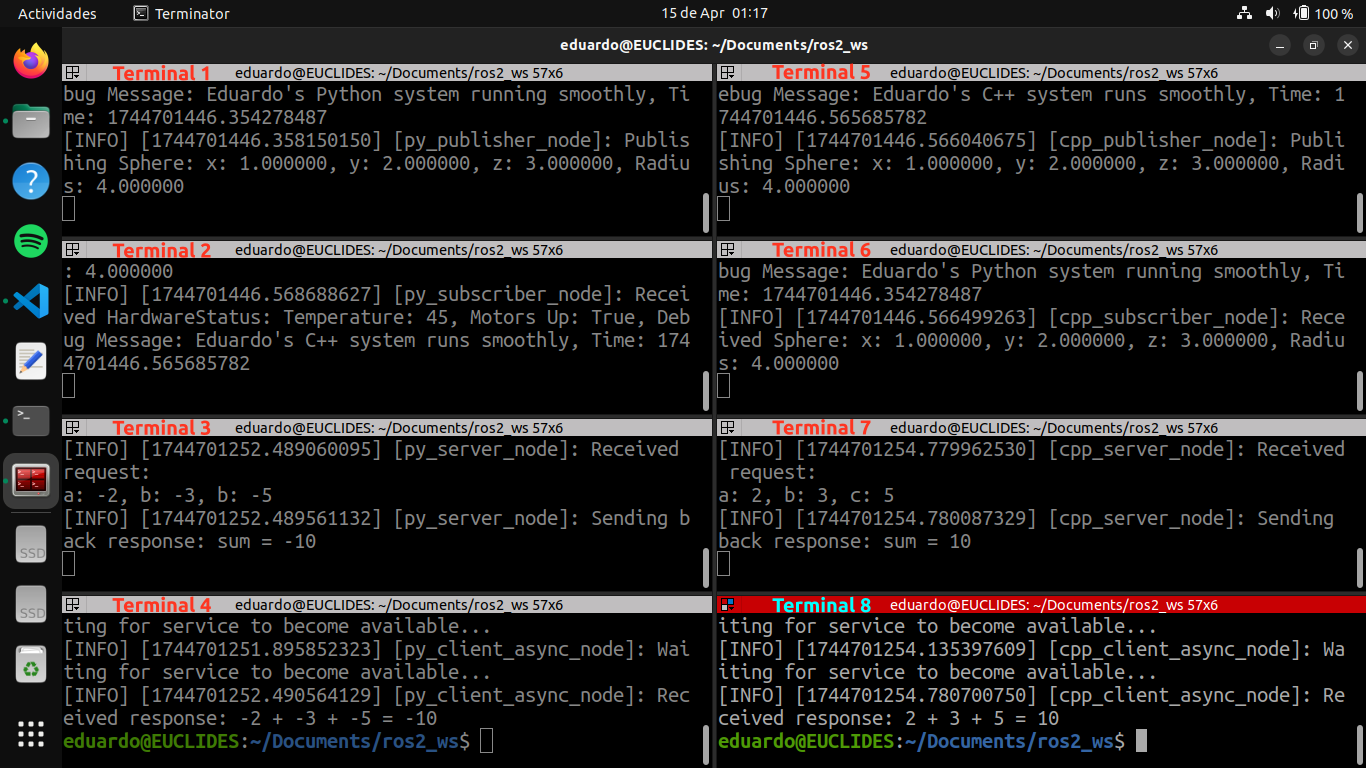 Figure: Example screenshot showing terminal outputs of the publishers, subscribers, services, and clients, in C++ and Python, in action.
Evidence 2:
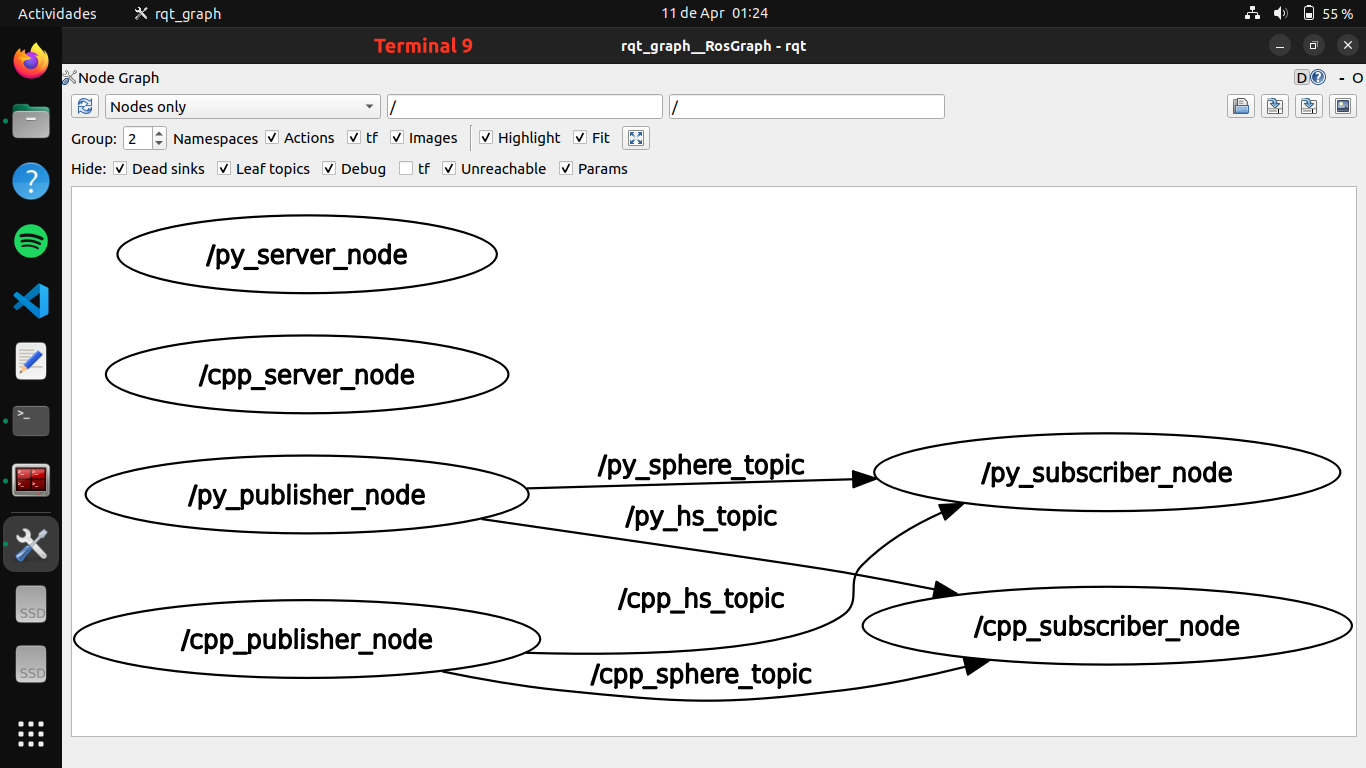 Figure: Example screenshot showing the ROS 2 graph of the publisher, subscriber, and service nodes.
5. ROS 2 Parameters, YAML, and Launch Files (Image Acquisition)
Executing ROS 2 Image Publishers and Subscribers
After editing and saving your C++ and Python nodes, and updating the CMakeLists.txt, setup.py, and package.xml files, build the packages:
colcon build --packages-select s5_cpp_camera
colcon build --packages-select s5_cpp_camera_usr
colcon build --packages-select s5_py_camera
colcon build --packages-select s5_py_camera_usr
Then, in three separate terminal sessions (or using the Terminator emulator), source your ROS 2 workspace in each terminal and run the following:
-
Terminal 1: Run either the C++ or Python image publisher node:
source install/setup.bash ros2 run s5_cpp_camera camera_exe -
Terminal 2: Run the C++ image subscriber node:
source install/setup.bash ros2 run s5_cpp_camera_usr camera_usr_exe -
Terminal 3: Run the Python image subscriber node:
source install/setup.bash
ros2 run s5_py_camera_usr camera_usr_exe
You should observe that:
- The
cpp_cameraorpy_cameranode publishes the image message. - Both
cpp_camera_usrandpy_camera_usrnodes receive the image message.
Visualizing the Image Topic with rqt_image_view
To verify that the publisher is correctly publishing the image topic, use:
ros2 run rqt_image_view rqt_image_view
This will display the image stream from either the C++ or Python image publisher node.
Visualizing the ROS Graph with rqt_graph
To ensure that the publisher and subscriber nodes are correctly connected, run in a new terminal:
ros2 run rqt_graph rqt_graph
Or simply:
rqt_graph
This will show the image topic being published and subscribed to, confirming proper ROS 2 graph connectivity.
Evidence 1:
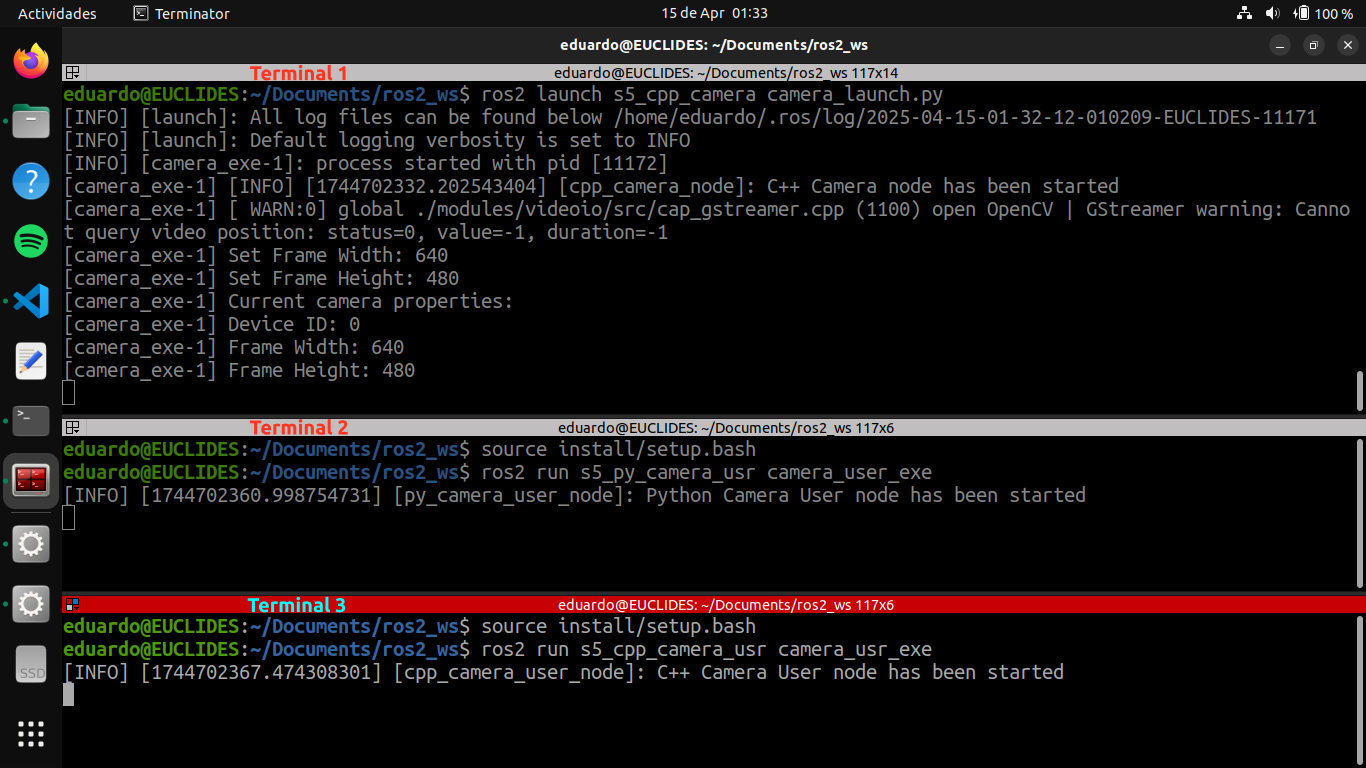 Figure: Example screenshot showing terminal outputs of the publisher and subscribers, in C++ and Python, in action.
Evidence 2:
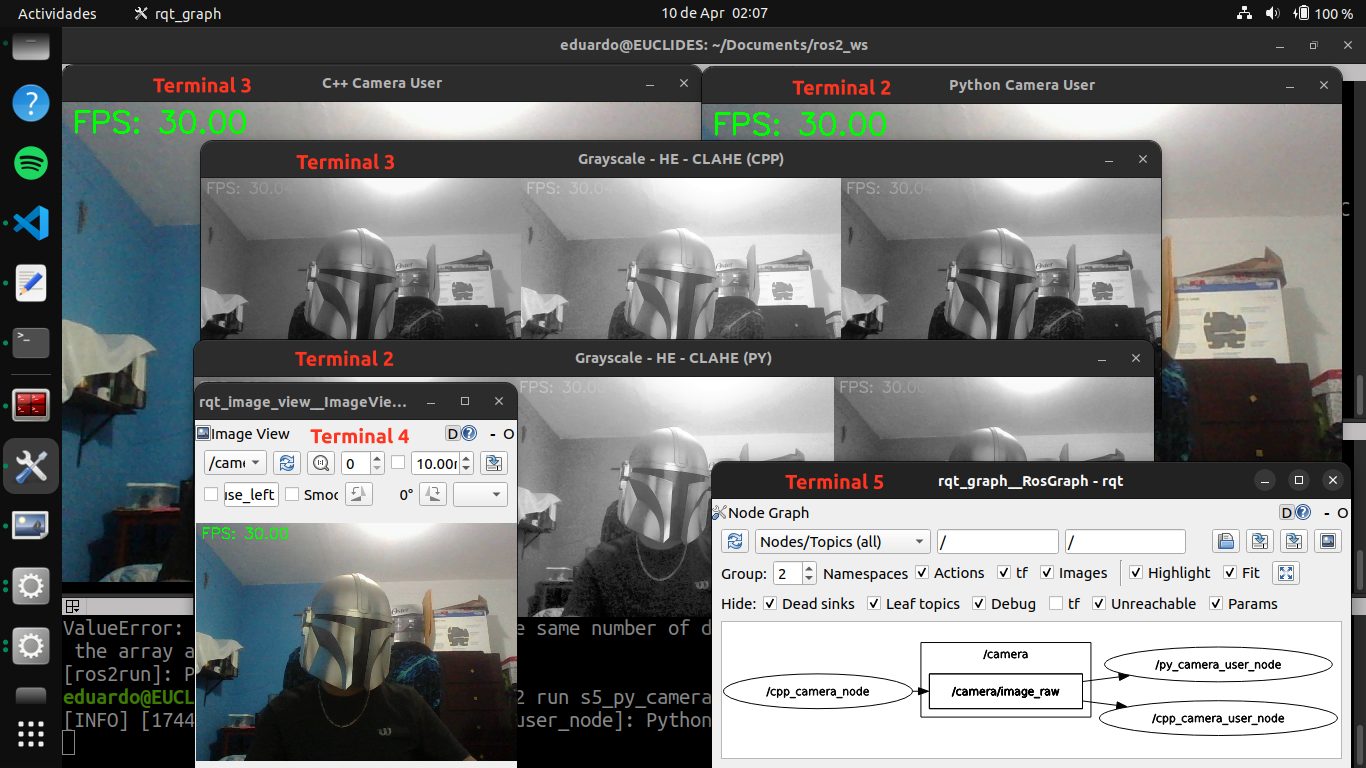 Figure: Example screenshot showing the image windows and the ROS 2 graph of the publisher and subscriber nodes.
6. URDF Modeling and Launch Files (Robot States)
Executing ROS 2 Robot State Publishers
After editing and saving your C++ and Python nodes, and updating the CMakeLists.txt, setup.py, and package.xml files, build the packages:
colcon build --packages-select s6_cpp_urdf
colcon build --packages-select s6_py_urdf
Then, in two terminals, source the workspace environment and run:
-
Terminal 1: Launch the robot state publisher node (C++ or Python):
source install/setup.bash ros2 launch s6_py_urdf rdk_x3_robot_launch.py -
Terminal 2: Launch RViz with the provided configuration file:
source install/setup.bash
rviz2 -d src/s6_py_urdf/rviz/rdk_x3_robot.rviz
You should observe:
- The
robot_state_publishernode publishing the URDF model and TFs. - The
rdk_x3_robotnode publishing joint states for dynamic updates in RViz.
Visualizing the Frames with view_frames
To view the coordinate frame hierarchy, run:
ros2 run tf2_tools view_frames
This will generate a PDF file in the current directory, showing the TF tree published by the robot’s robot_state_publisher node.
Visualizing the ROS Graph with rqt_graph
To verify that the robot state publisher nodes are correctly connected, use:
ros2 run rqt_graph rqt_graph
Or simply:
rqt_graph
This will show the joint_states topic and how the publisher nodes are linked.
Evidence 1:
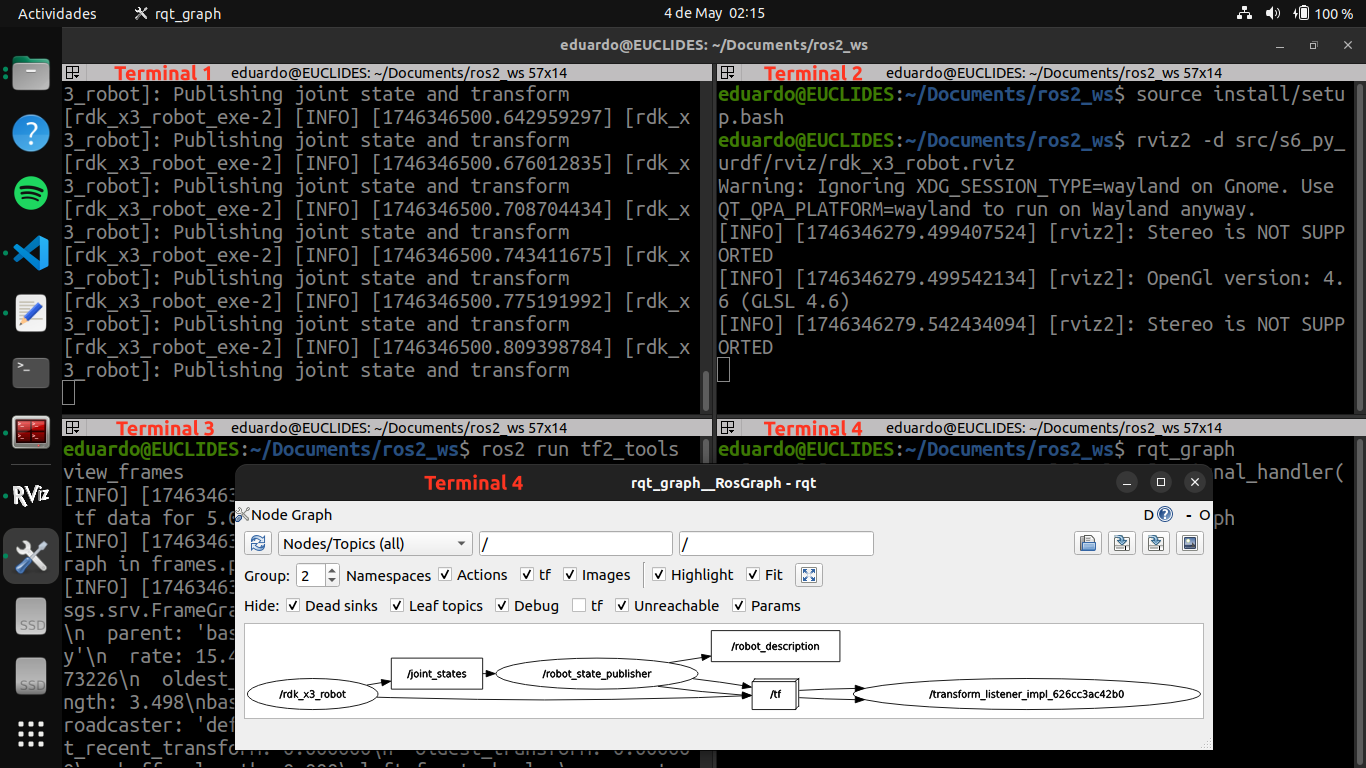 Figure: Example screenshot showing terminal outputs and the ROS 2 graph of the robot state publishers in action.
Evidence 2:
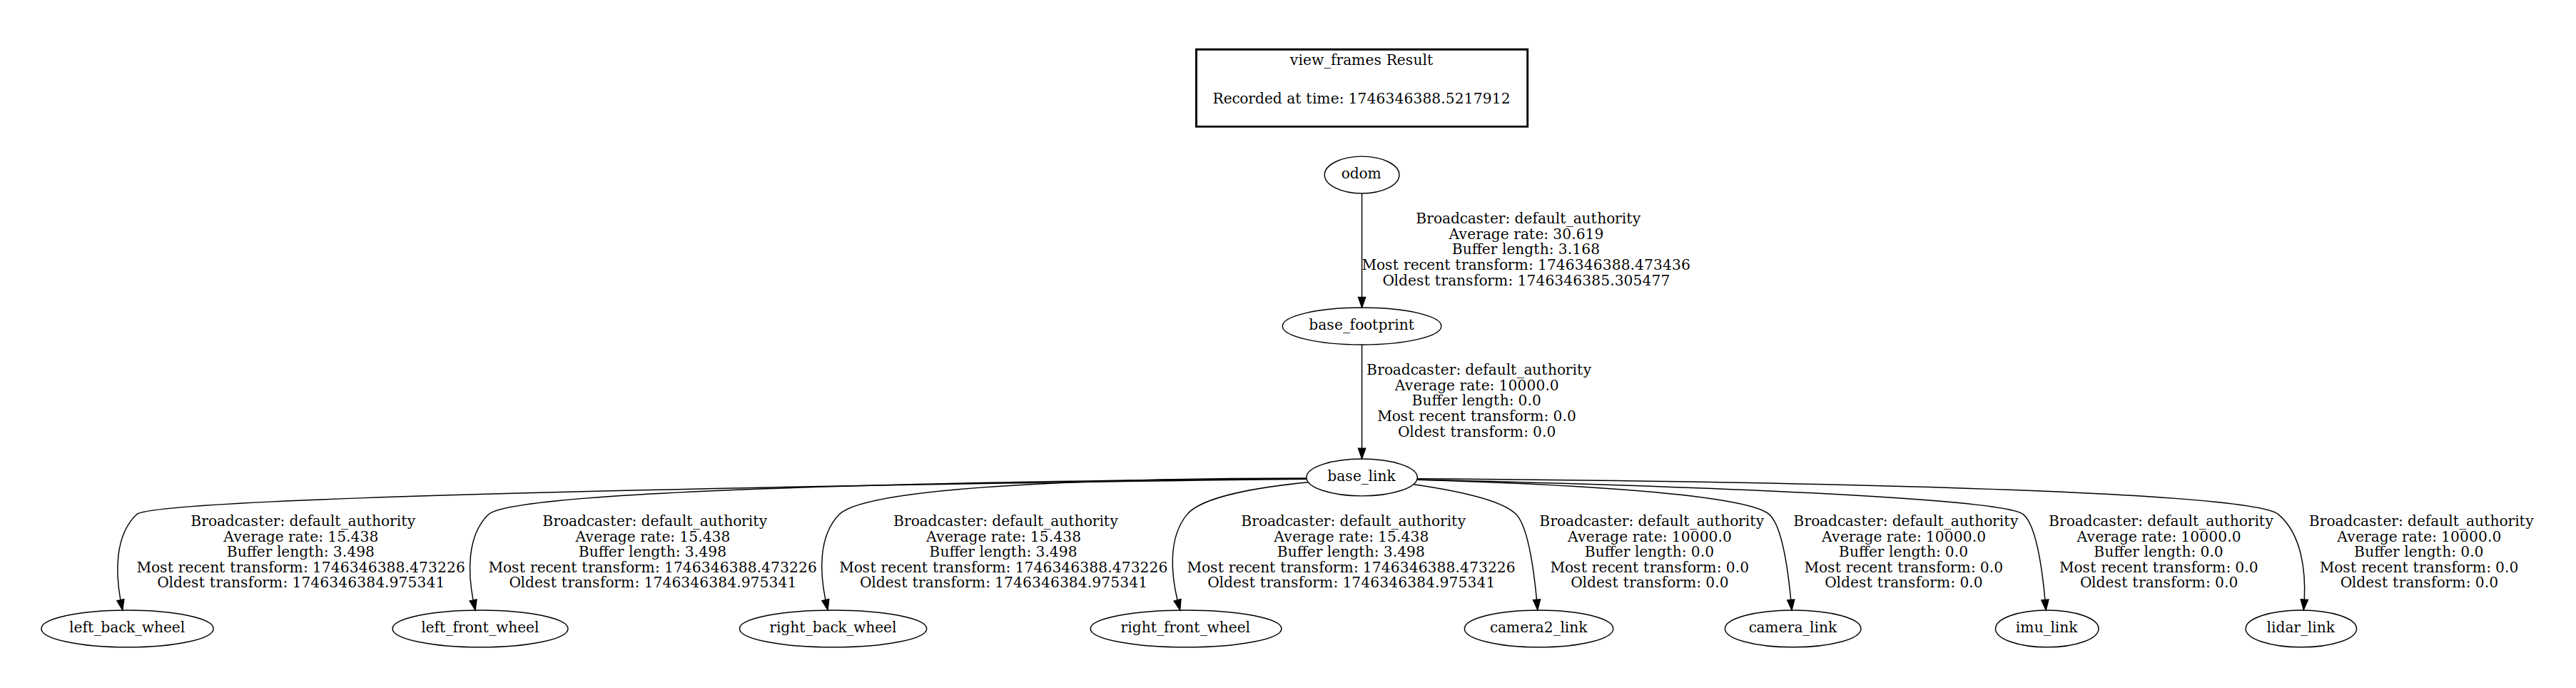 Figure: PDF showing the graphical representation of the current coordinate frame tree.
Evidence 3:
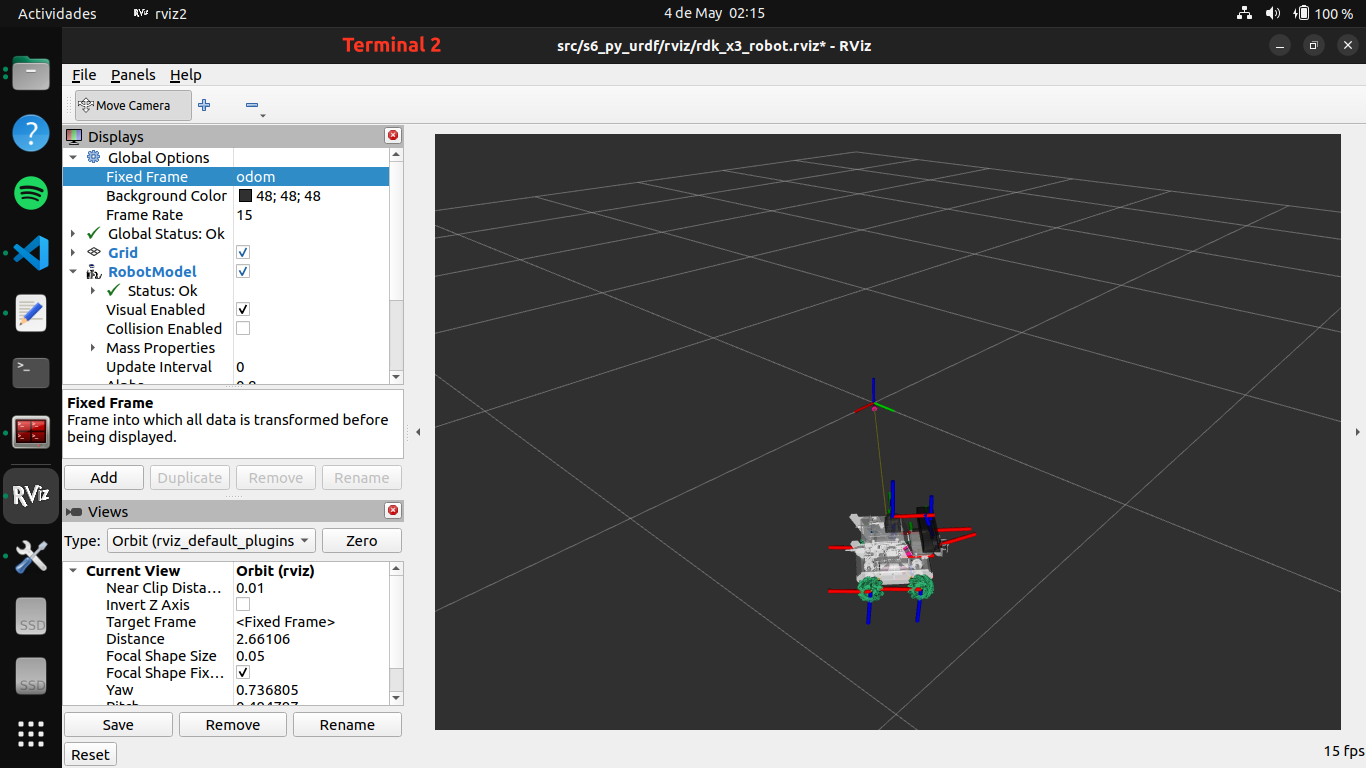 Figure: Example screenshot showing the simulation of the RDK X3 Robot in RViz.
7. tf2 Library (Robot Network)
Executing ROS 2 Robot Status Publishers
After editing and saving the Python nodes and updating the CMakeLists.txt, setup.py, and package.xml files, build the packages:
colcon build --packages-select s7_robot_network_interface
colcon build --packages-select s7_py_task_manager
colcon build --packages-select s7_py_client_robot
colcon build --packages-select s7_py_robot_task_monitoring
Then, in five terminals, source your ROS 2 workspace in each and execute:
-
Terminal 1 – Run the pose server node:
source install/setup.bash ros2 run s7_py_task_manager task_manager_exe -
Terminal 2 – Launch the robot client node:
source install/setup.bash ros2 launch s7_py_client_robot client_robots_launch.py -
Terminal 3 – Launch pose/status sub-pub nodes:
source install/setup.bash ros2 launch s7_py_robot_task_monitoring robot_network_launch.py -
Terminal 4 – Launch RViz:
source install/setup.bash rviz2 -d src/s7_py_robot_task_monitoring/rviz/robot_network.rviz -
Terminal 5 – Run the robot status logger:
source install/setup.bash
ros2 run s7_py_robot_task_monitoring robot_status_logger_exe
You should observe:
- The
task_managernode processing service requests from therobot1client. - The
cylinder1/robot_state_publisherandcylinder2/robot_state_publisherpublishing pickup/delivery poses. - The
robot1/robot_state_publisherbroadcasting robot1’s URDF model and TFs. - The
cylindersnode broadcasting TFs for pickup and delivery poses. - The
robotsnode publishing robot1’s status and joint states. - The
robot_status_loggernode printing the robot status when data is received.
Visualizing the Frame Tree with view_frames
To observe the current frame hierarchy, use:
ros2 run tf2_tools view_frames
This generates a PDF file in the current terminal directory, representing the current TF tree.
Visualizing the ROS Graph with rqt_graph
To verify the node connections, run:
ros2 run rqt_graph rqt_graph
Or:
rqt_graph
This shows the connections between all publishers, subscribers, services, and clients in the robot network.
Evidence 1:
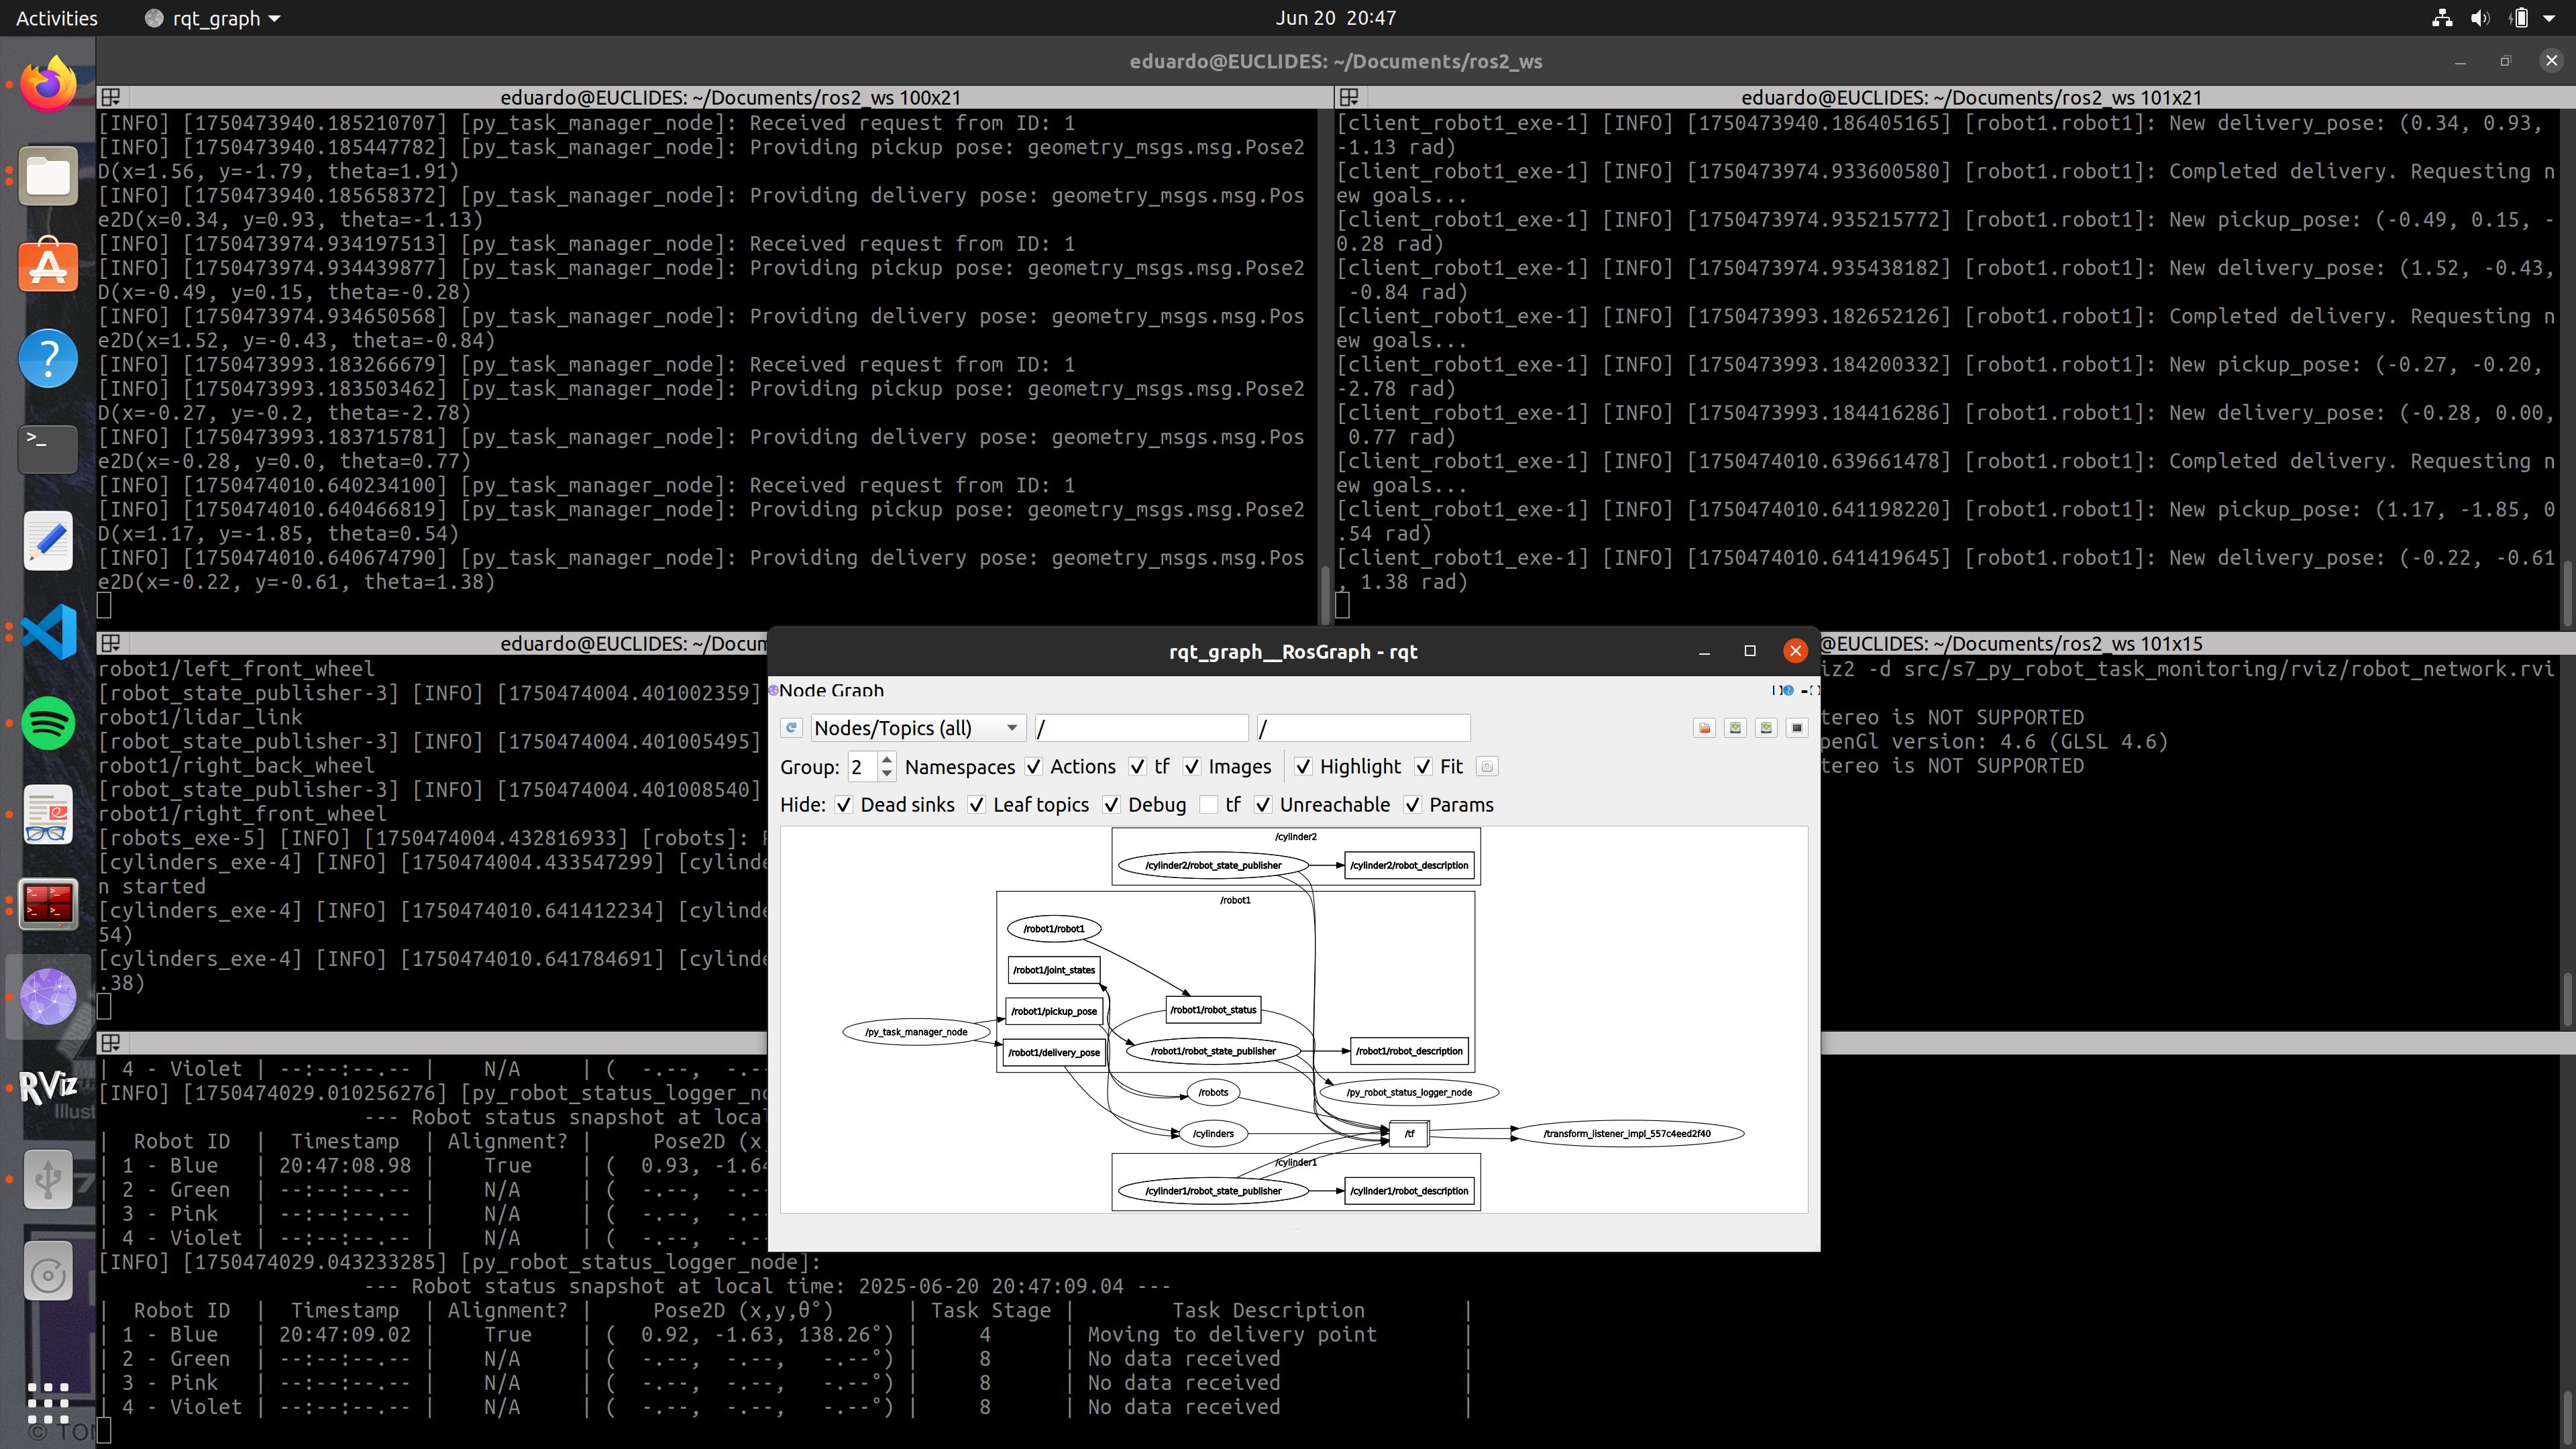 Figure: Example screenshot showing terminal outputs and the ROS 2 graph of the robot network in action.
Evidence 2:
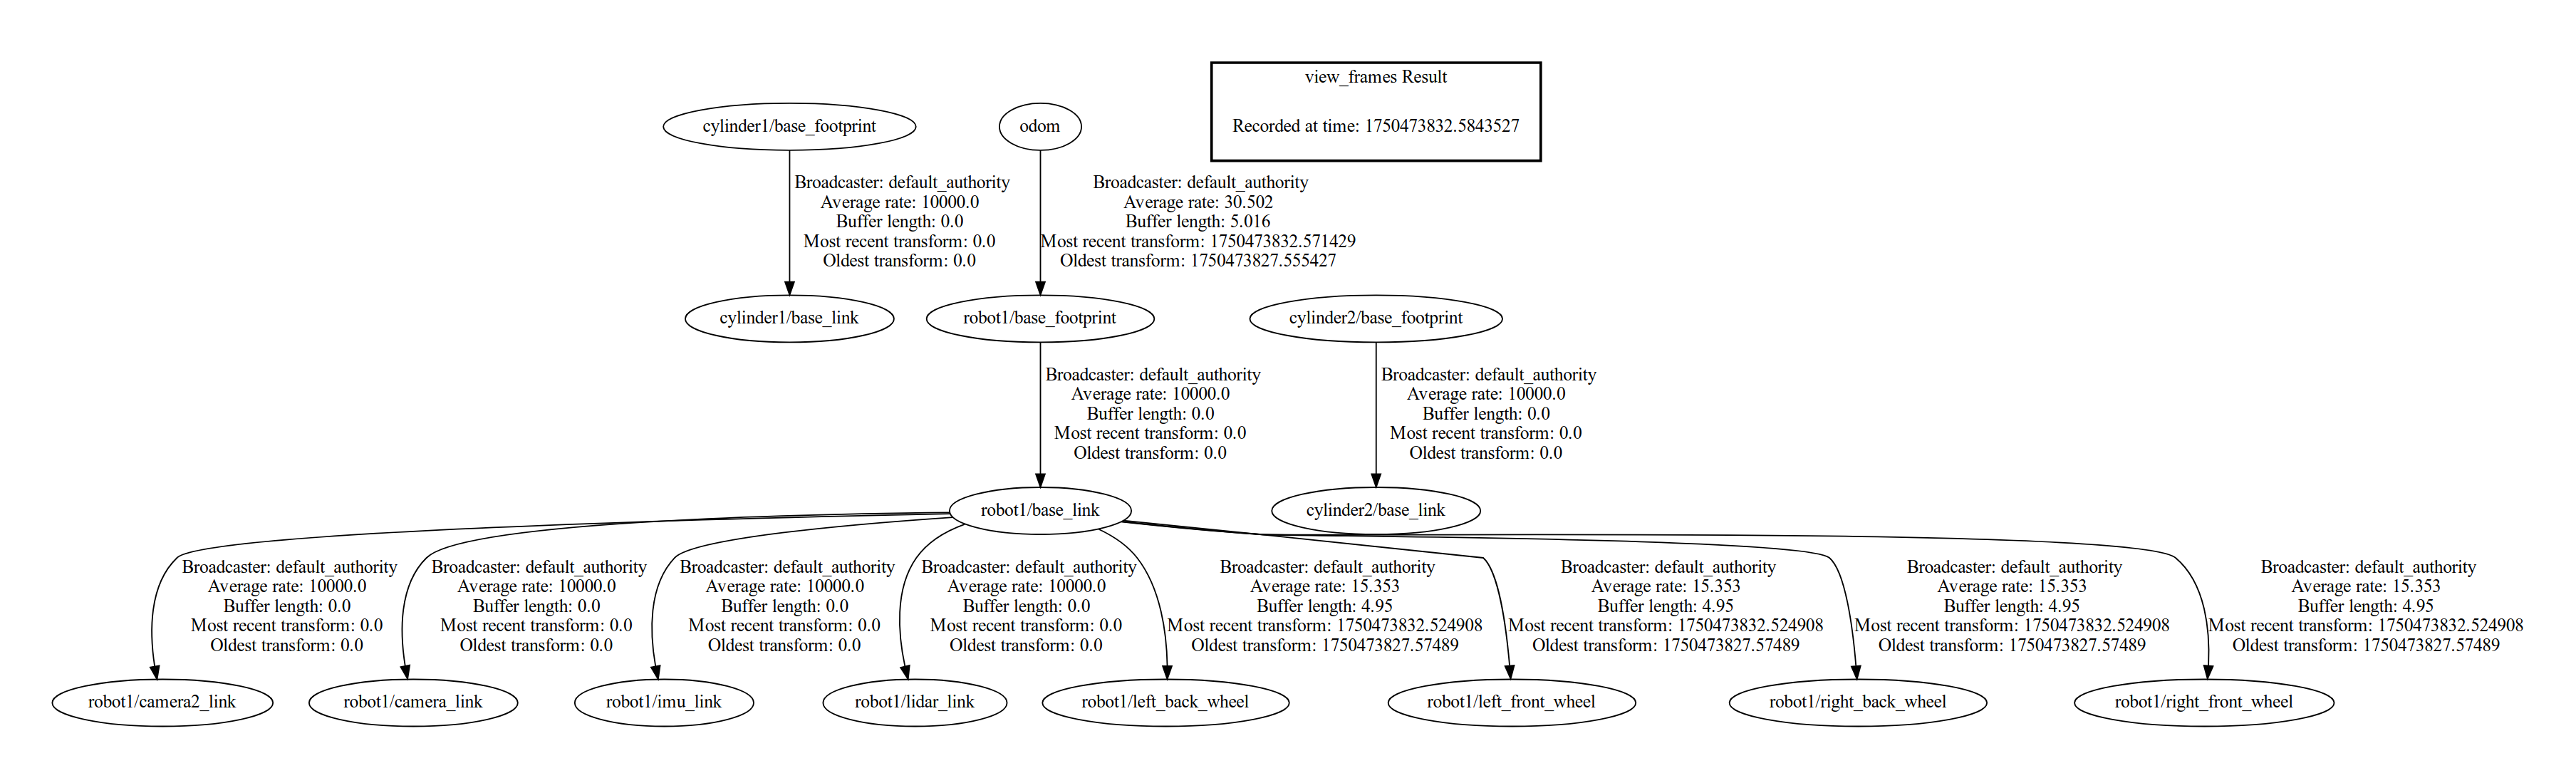 Figure: PDF showing the graphical representation of the current coordinate frame tree.
Evidence 3:
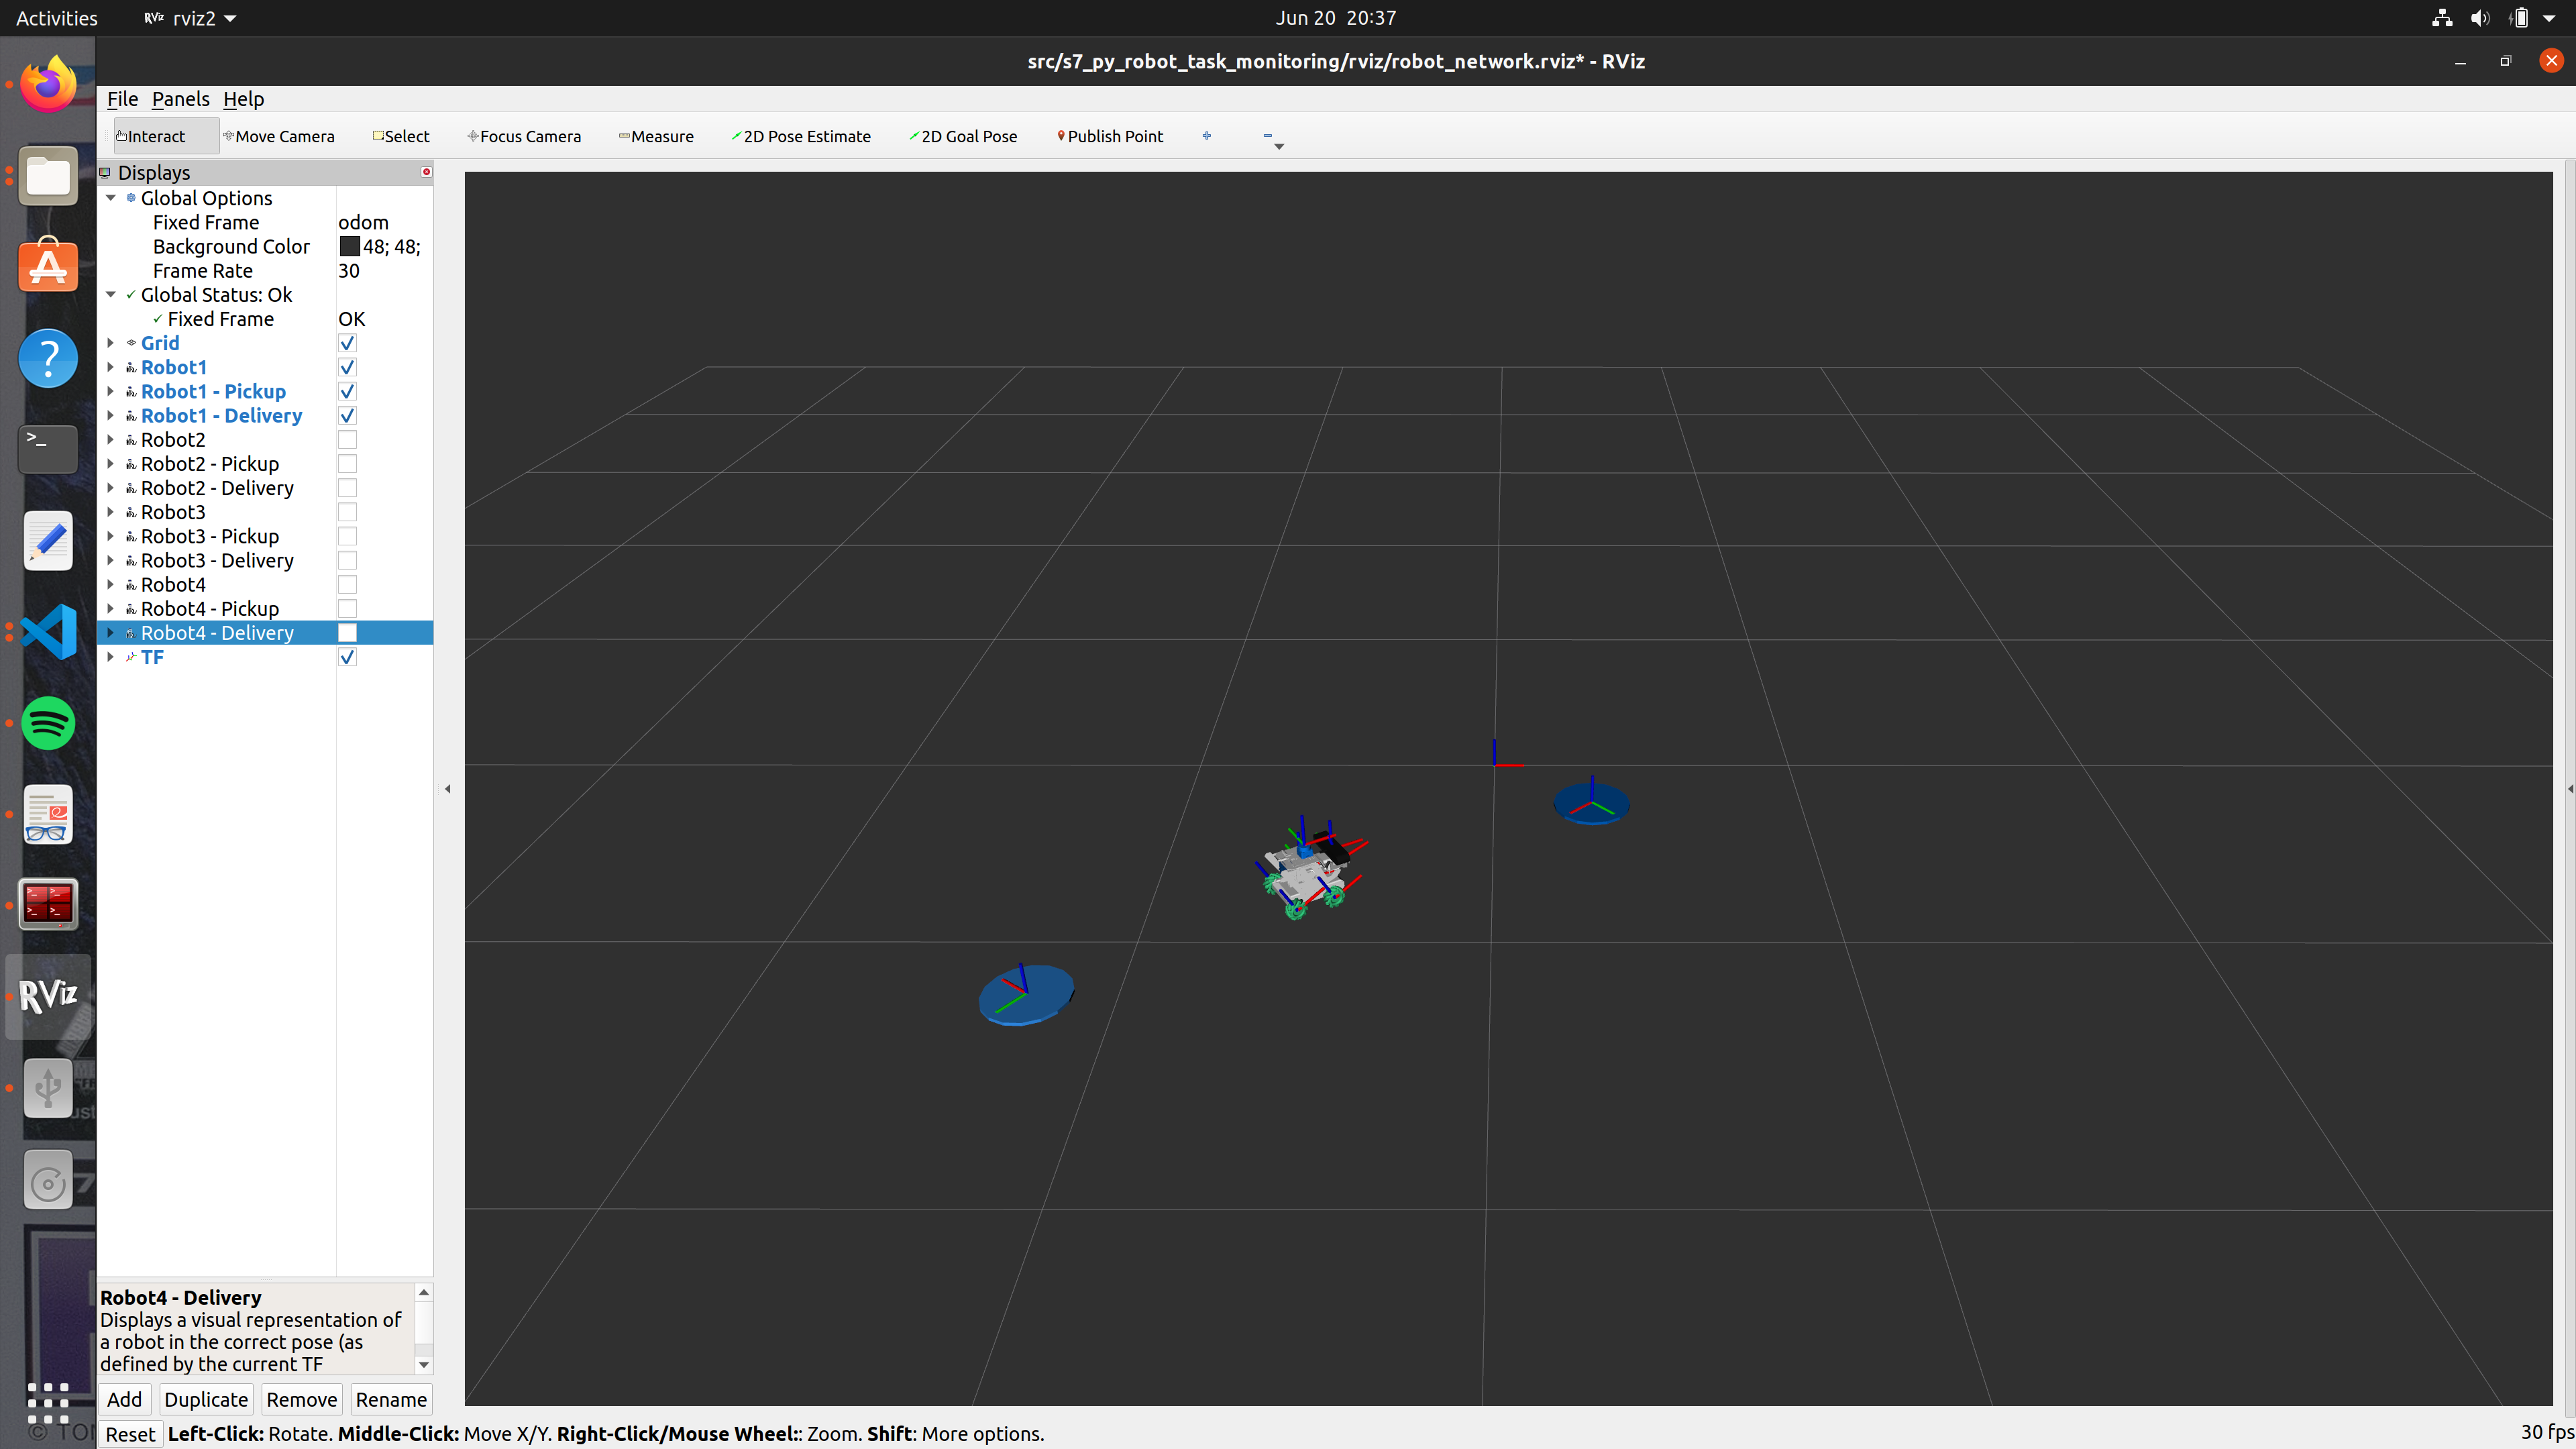 Figure: Example screenshot showing the visualization of the RDK X3
 Robot1 in RViz.
8. Occupancy Grid Map (SLAM Simulation)
Executing ROS 2 SLAM Simulation
After editing the Python nodes and updating CMakeLists.txt, setup.py, and package.xml, build the package:
colcon build --packages-select s8_py_slam
Then, in five separate terminals, source your workspace and run:
-
Terminal 1 – Launch the robot in Gazebo:
source install/setup.bash ros2 launch s8_py_slam spawn_robot_launch.py -
Terminal 2 – Display robot in RViz:
source install/setup.bash ros2 launch s8_py_slam display_robot_launch.py -
Terminal 3 – Start the SLAM node (with simulation time):
source install/setup.bash ros2 launch slam_toolbox online_async_launch.py use_sim_time:=True -
Terminal 4 – Run the pose publisher node:
source install/setup.bash ros2 run s8_py_slam pose_publisher_exe -
Terminal 5 – Run the teleop node (to control the robot):
source install/setup.bash
ros2 run teleop_twist_keyboard teleop_twist_keyboard
You should observe:
- The robot URDF model is spawned in Gazebo with a LiDAR plugin.
- The
robot_state_publishernode visualizes the robot in RViz. - An occupancy grid is built and displayed through the
/maptopic in RViz as the robot explores the environment.
Visualizing Frame Tree with view_frames
To generate a TF frame tree PDF:
ros2 run tf2_tools view_frames
This creates a frames.pdf in the current directory.
Visualizing the ROS Graph with rqt_graph
To check node and topic connections:
ros2 run rqt_graph rqt_graph
Or simply:
rqt_graph
This displays the complete ROS 2 graph for the SLAM setup.
Evidence 1:
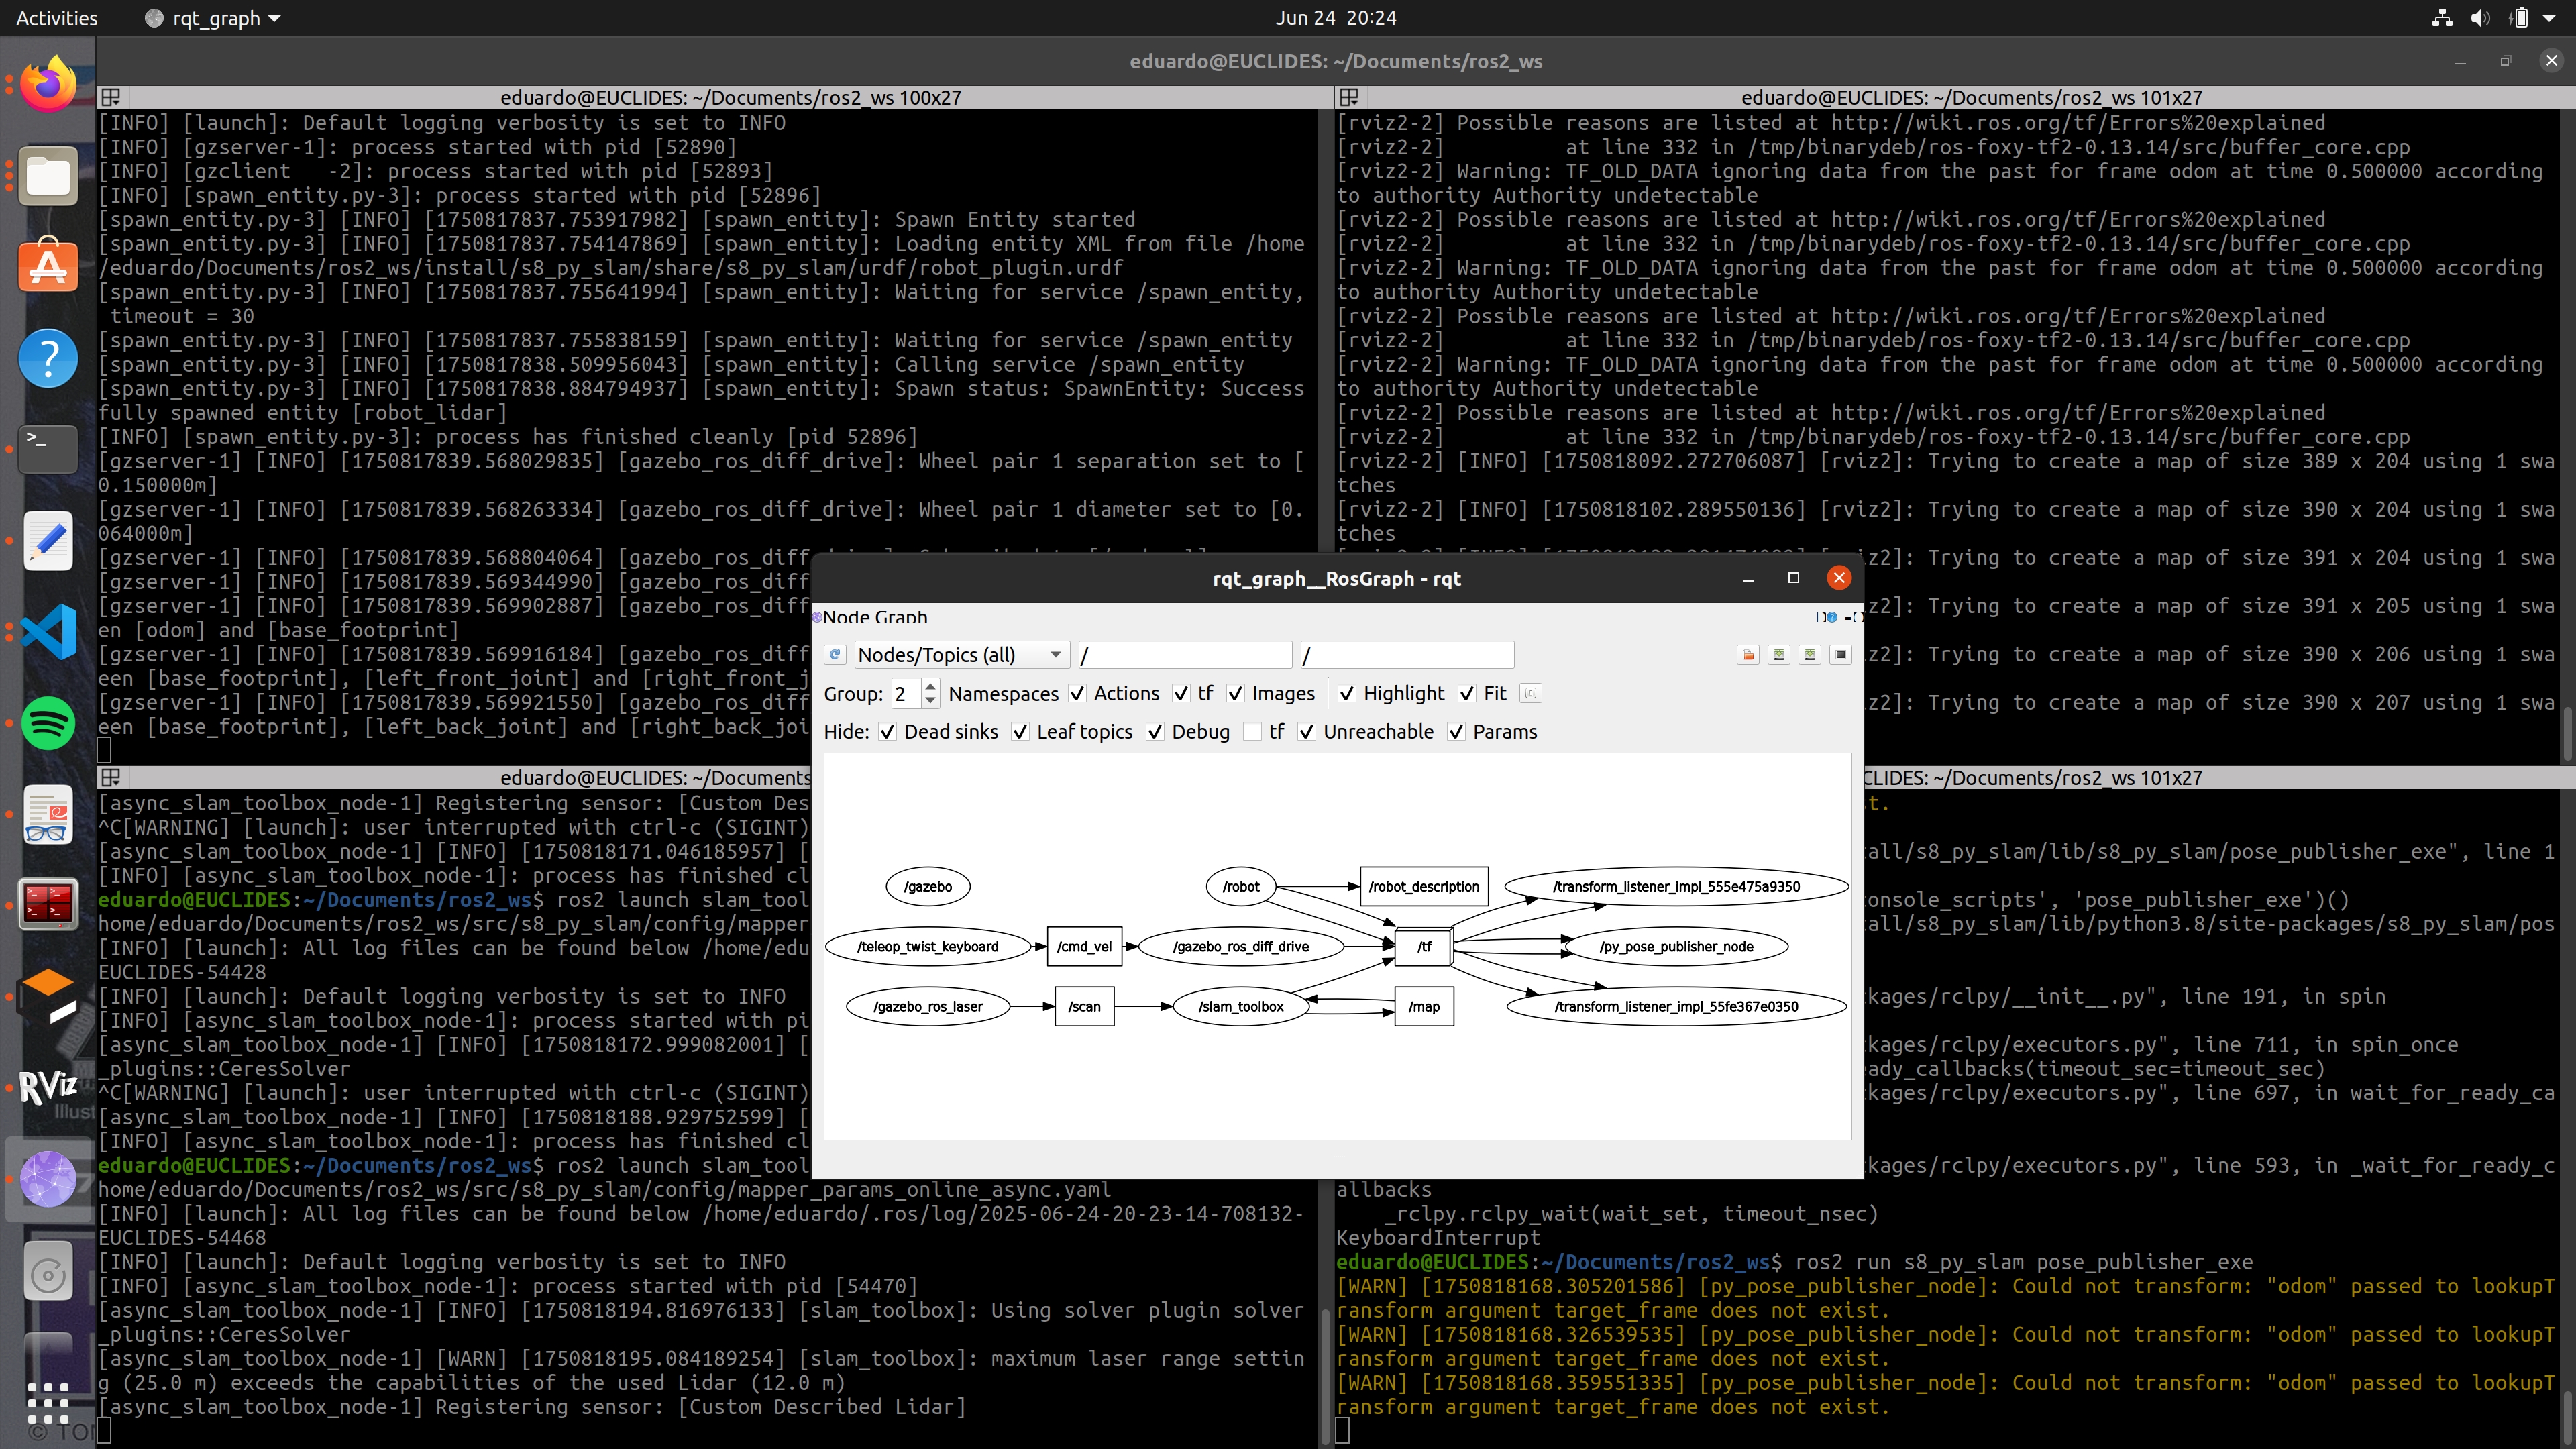 Figure: Terminal outputs and ROS 2 graph of the SLAM simulation.
Evidence 2:
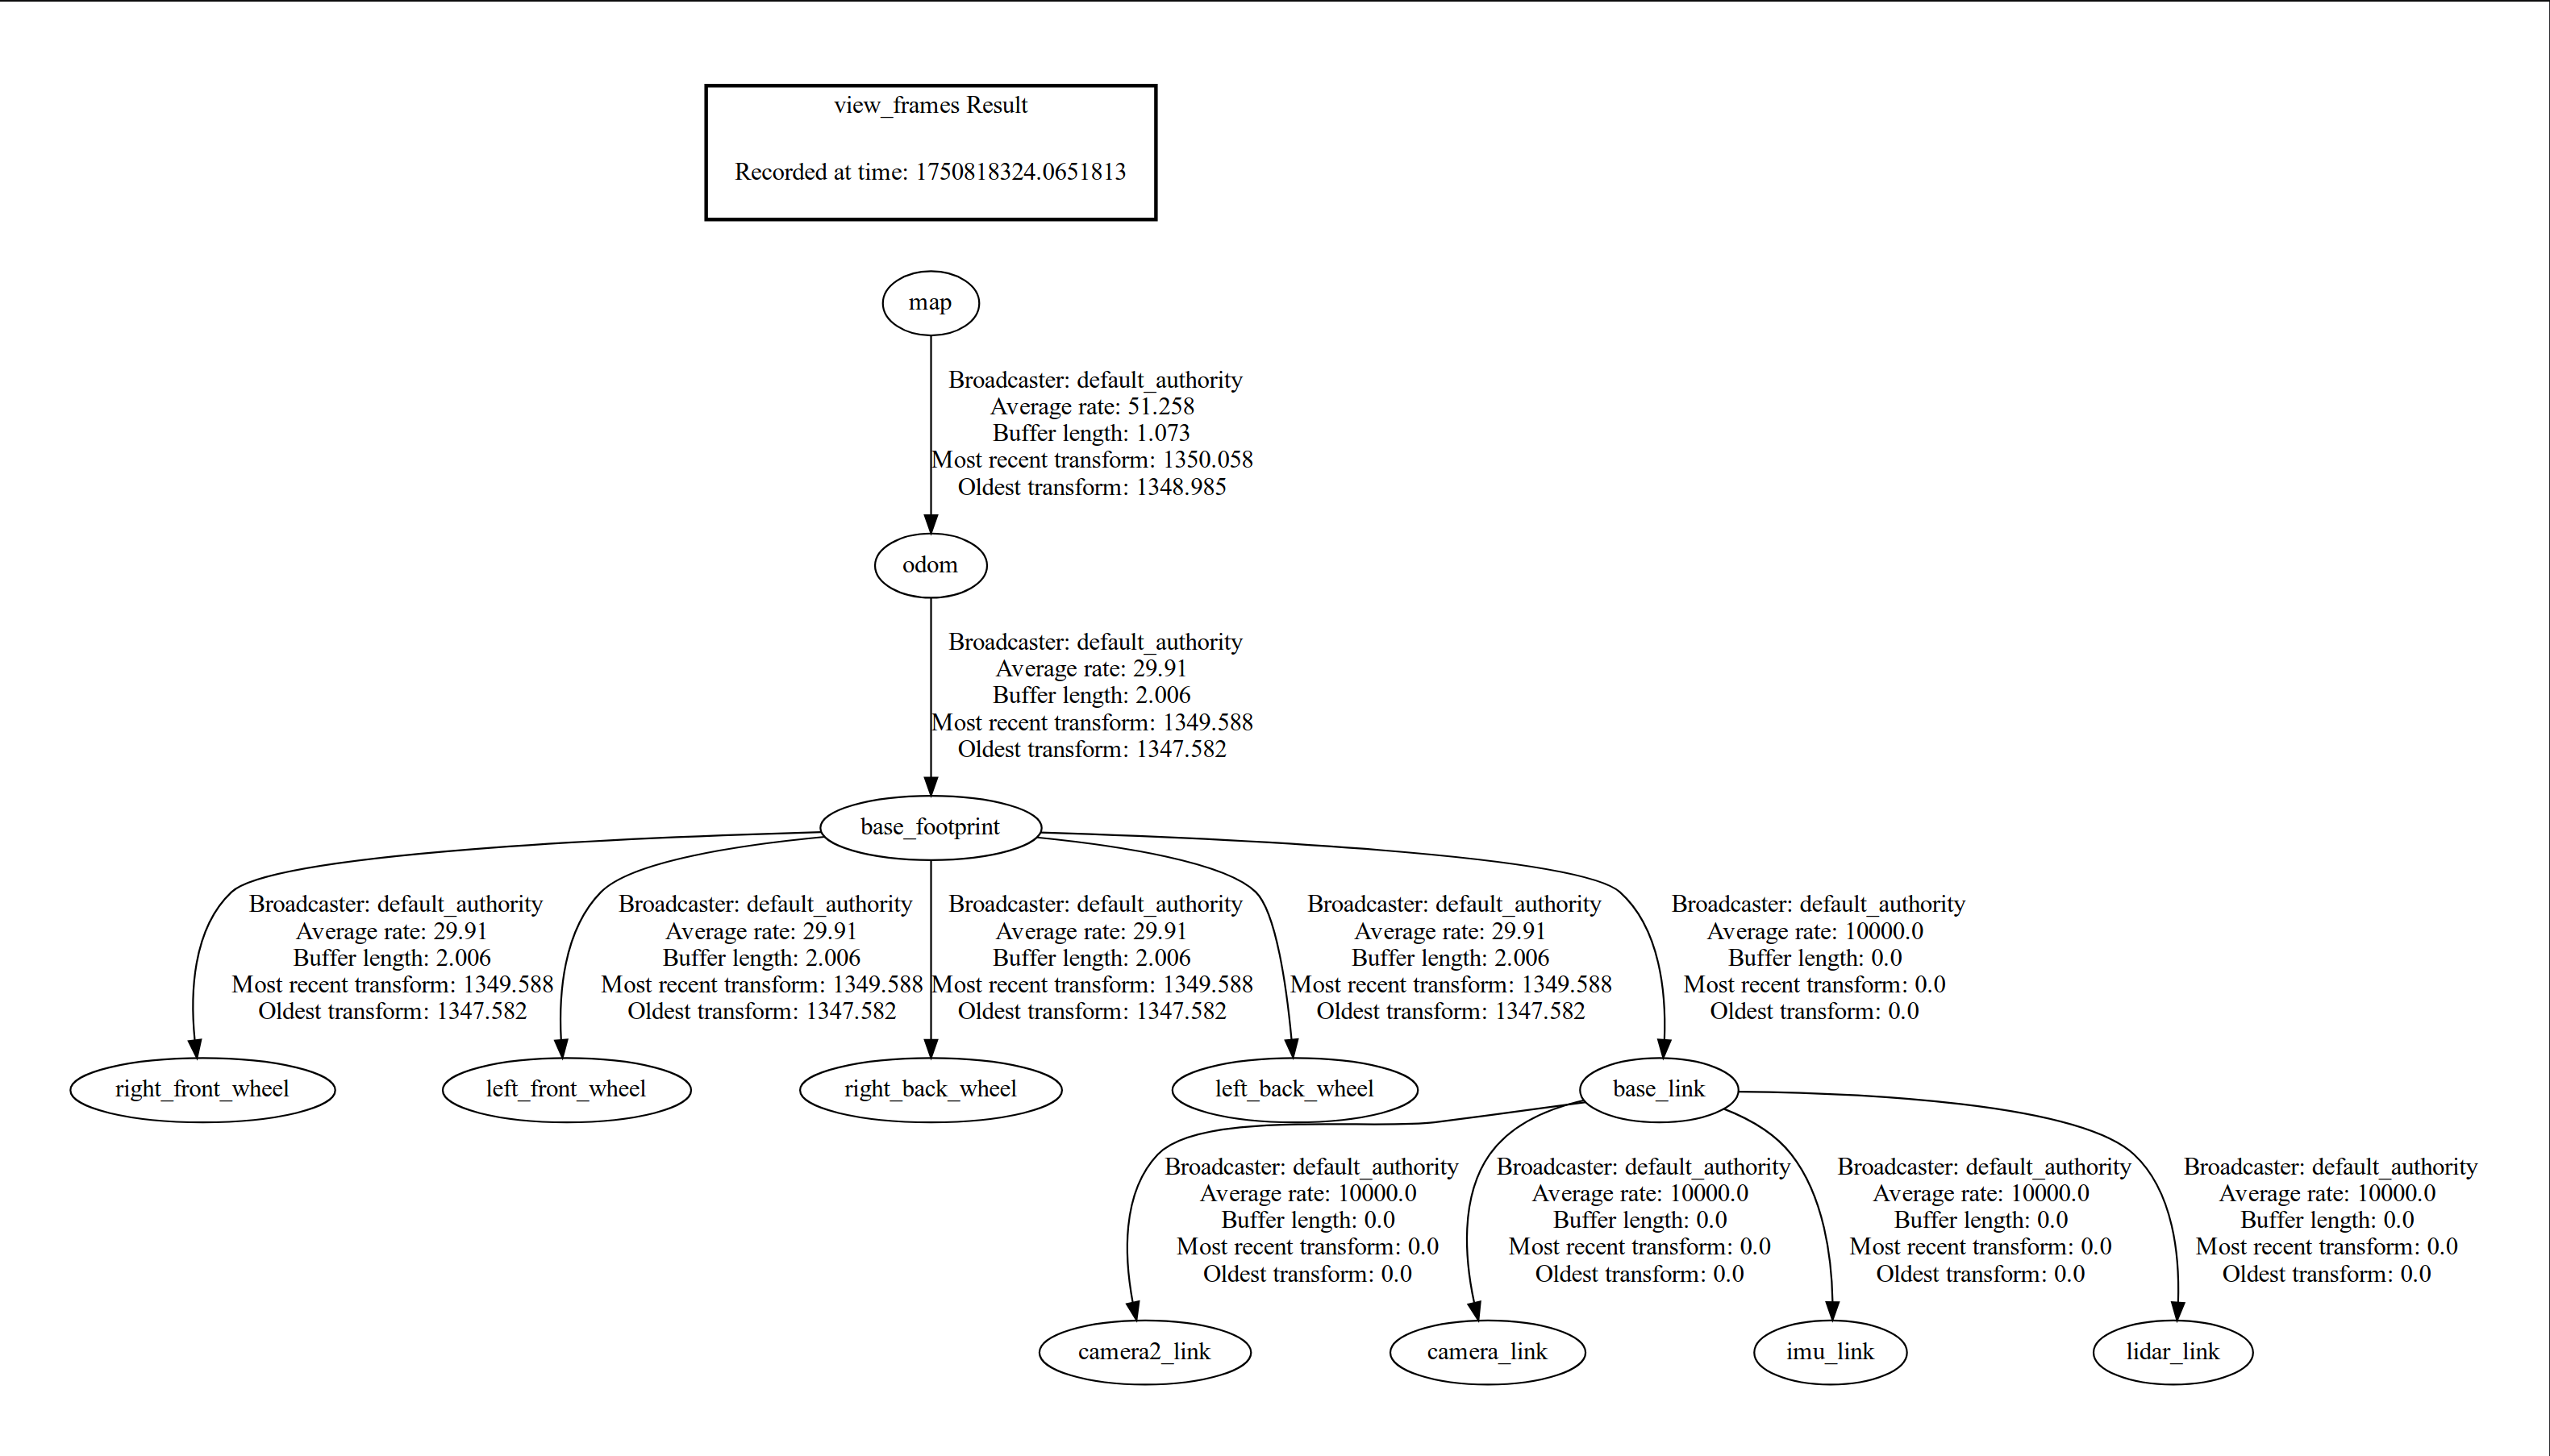 Figure: PDF showing the current coordinate frame tree.
Evidence 3:
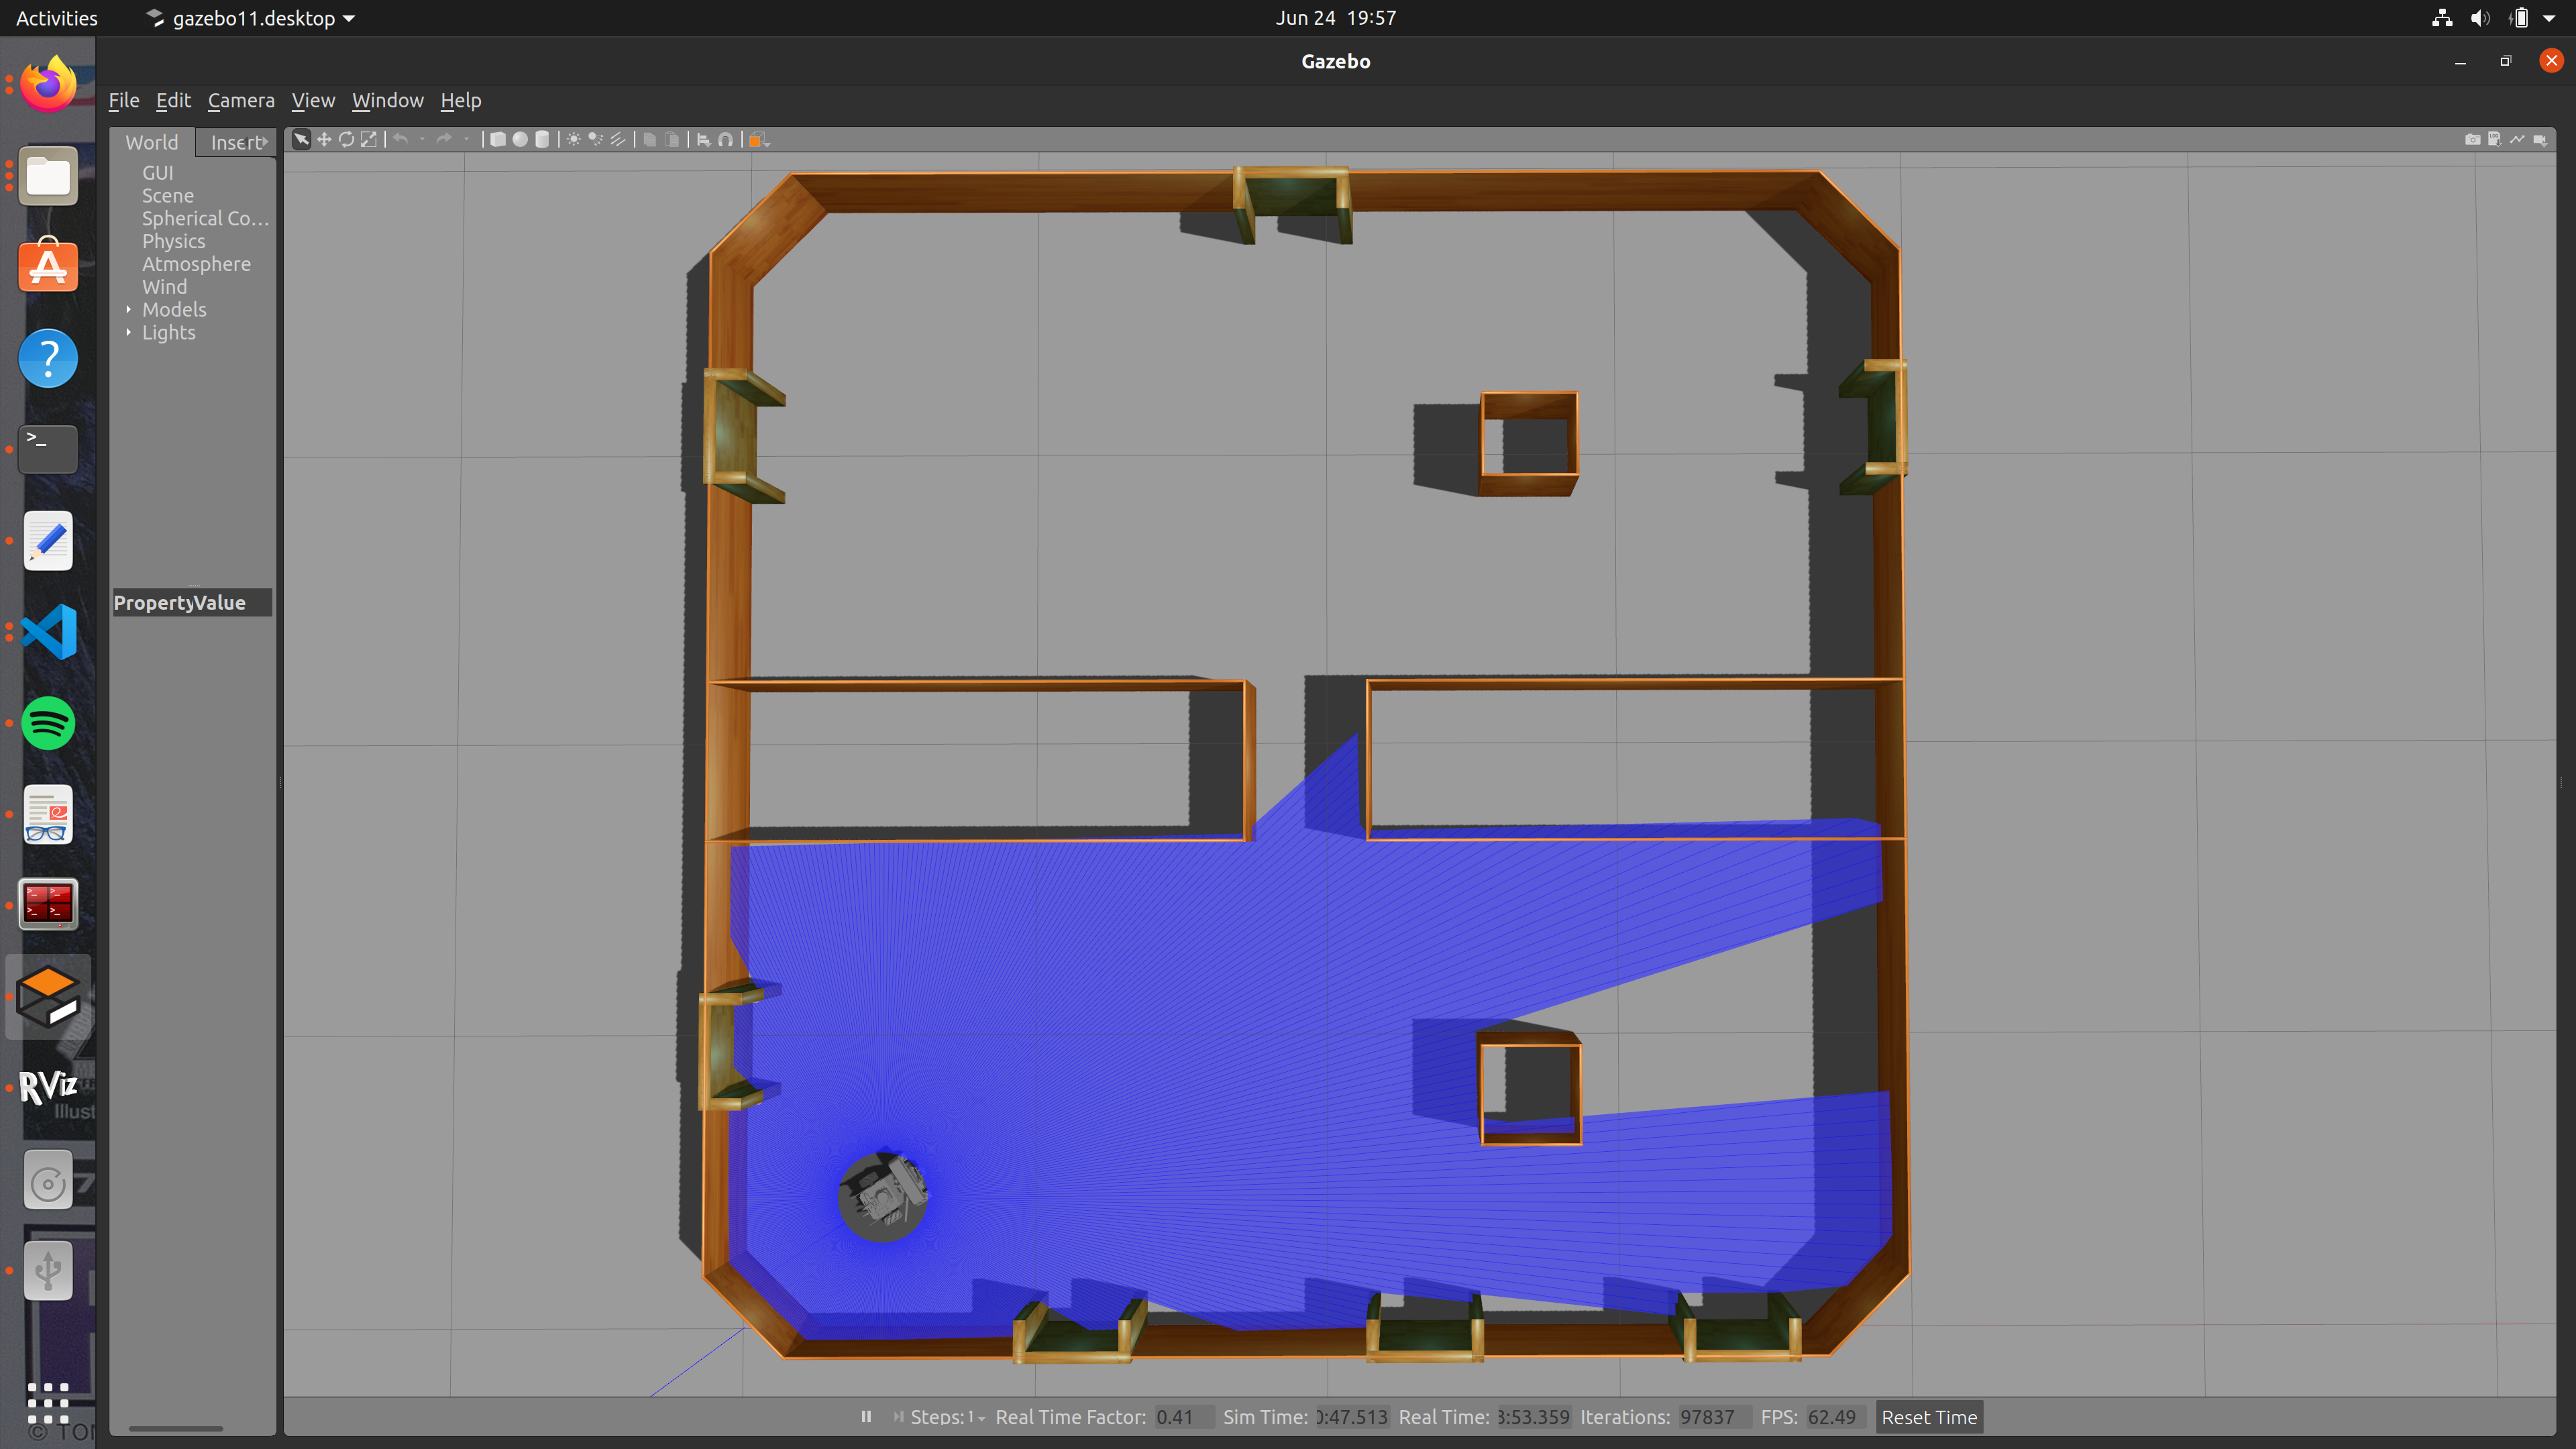 Figure: Simulation of the RDK X3 Robot in Gazebo.
Evidence 4:
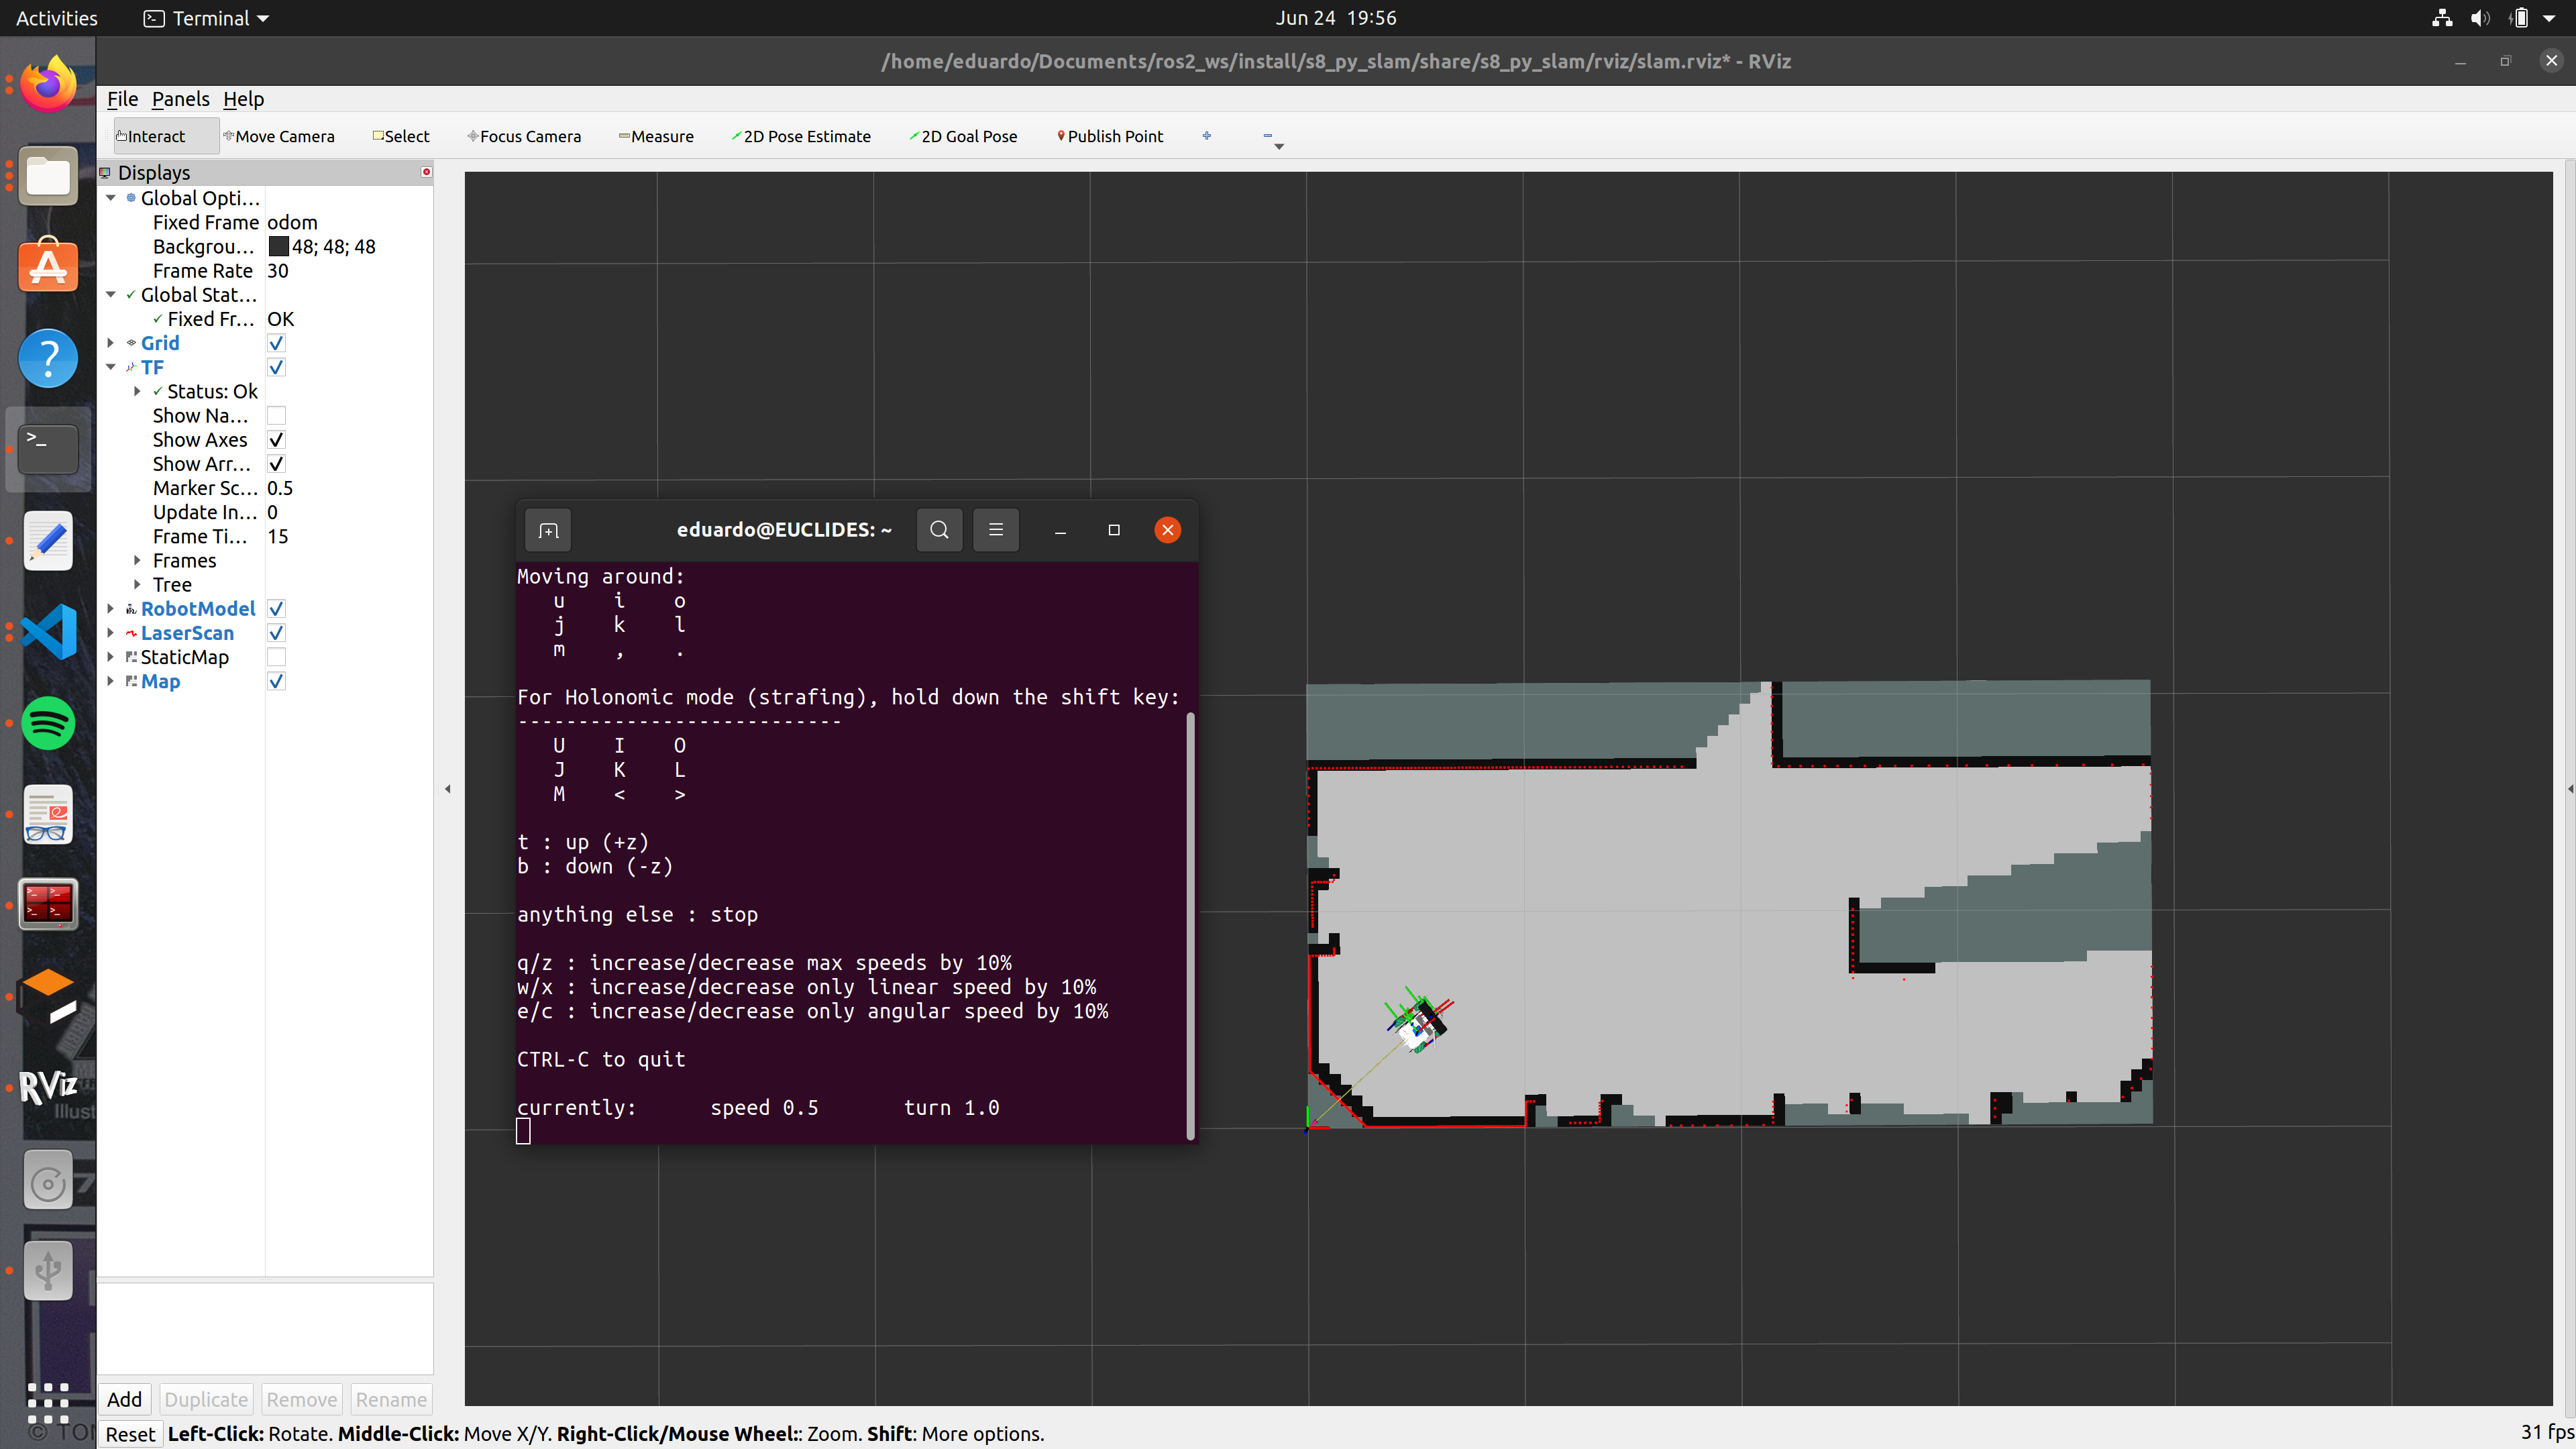 Figure: Visualization of the RDK X3 Robot in RViz.